
TRON Q1 2026 Quarterly Report
Executive Summary
In Q1 2026, TRON remained a top blockchain for stablecoin payments, settling $2.04T and supporting an $86.02B supply. The network sustained strong activity across payments, DeFi, and liquidity despite market cooling, while also expanding into AI-native financial infrastructure via the Agentic AI Foundation.
Network Activity
950M transactions and $604M revenue, demonstrating resilient usage
DeFi & Liquidity
TVL reached $26.0B (+7.38% QoQ), signaling renewed capital growth
Ecosystem & AI
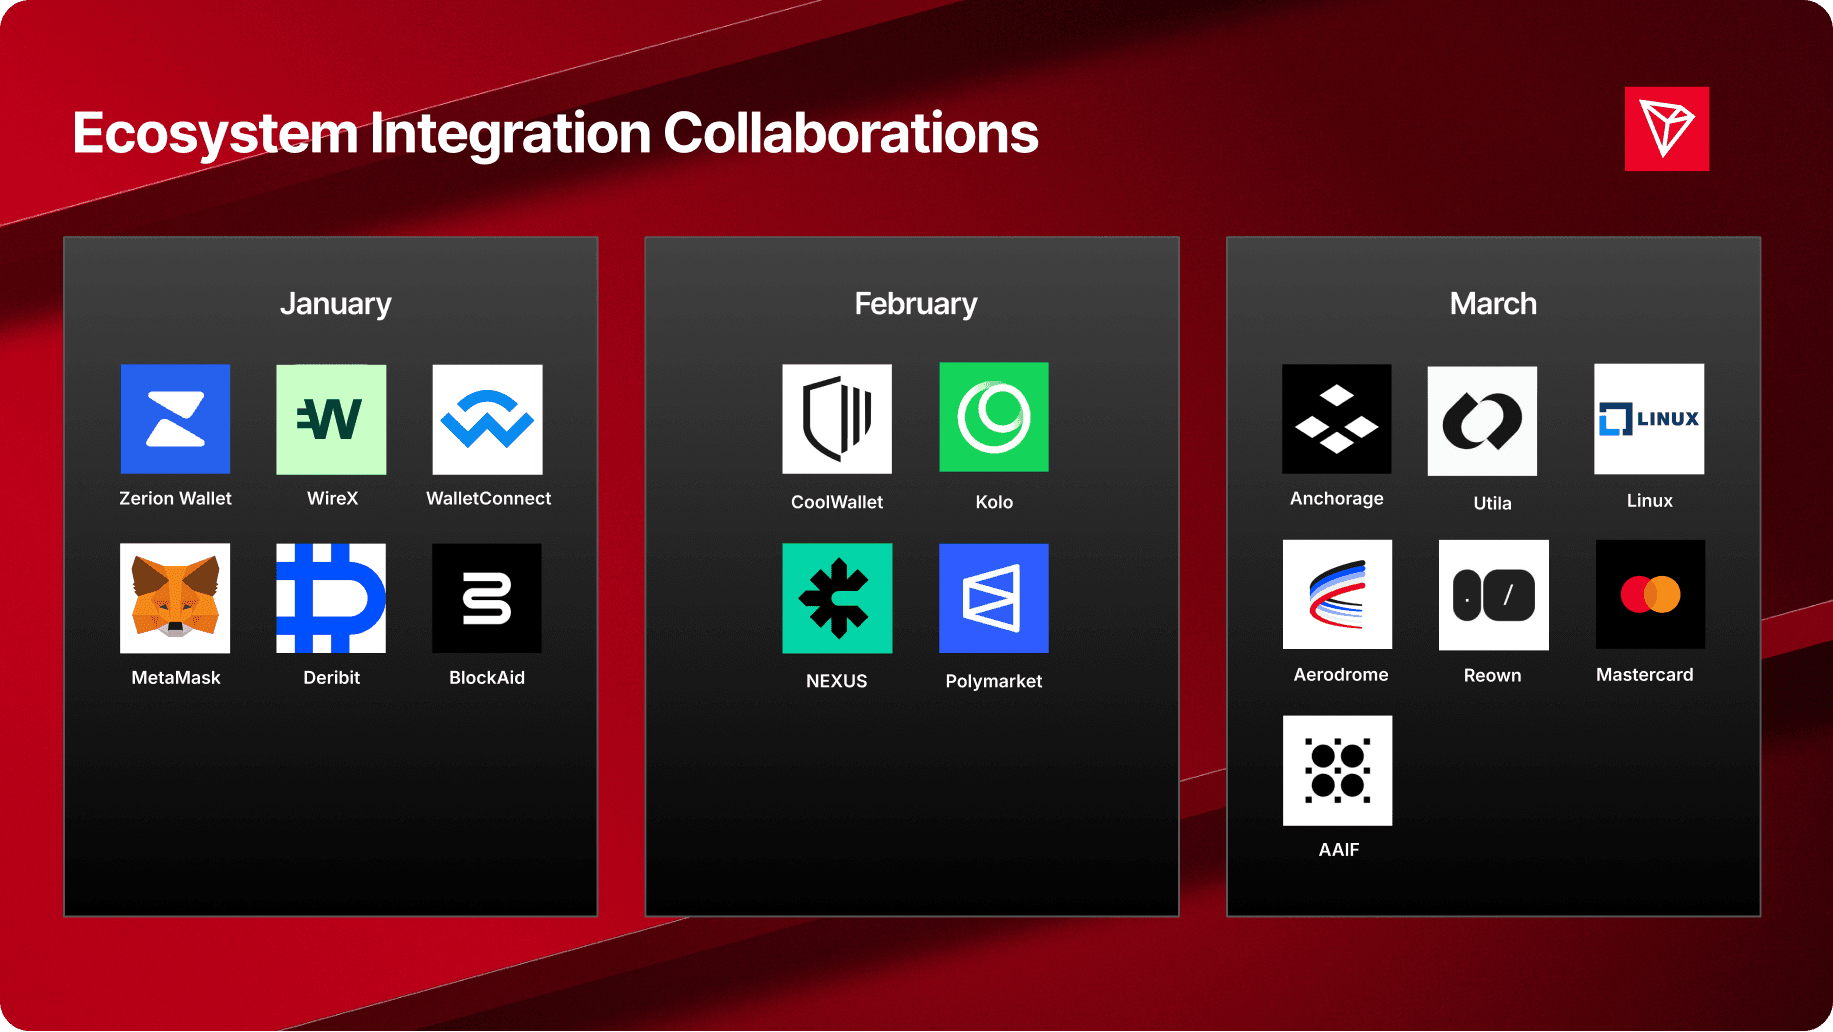
Expanded integrations (MetaMask, WalletConnect, Anchorage, Mastercard) and early positioning in AI agent payments
Network Activity and Usage
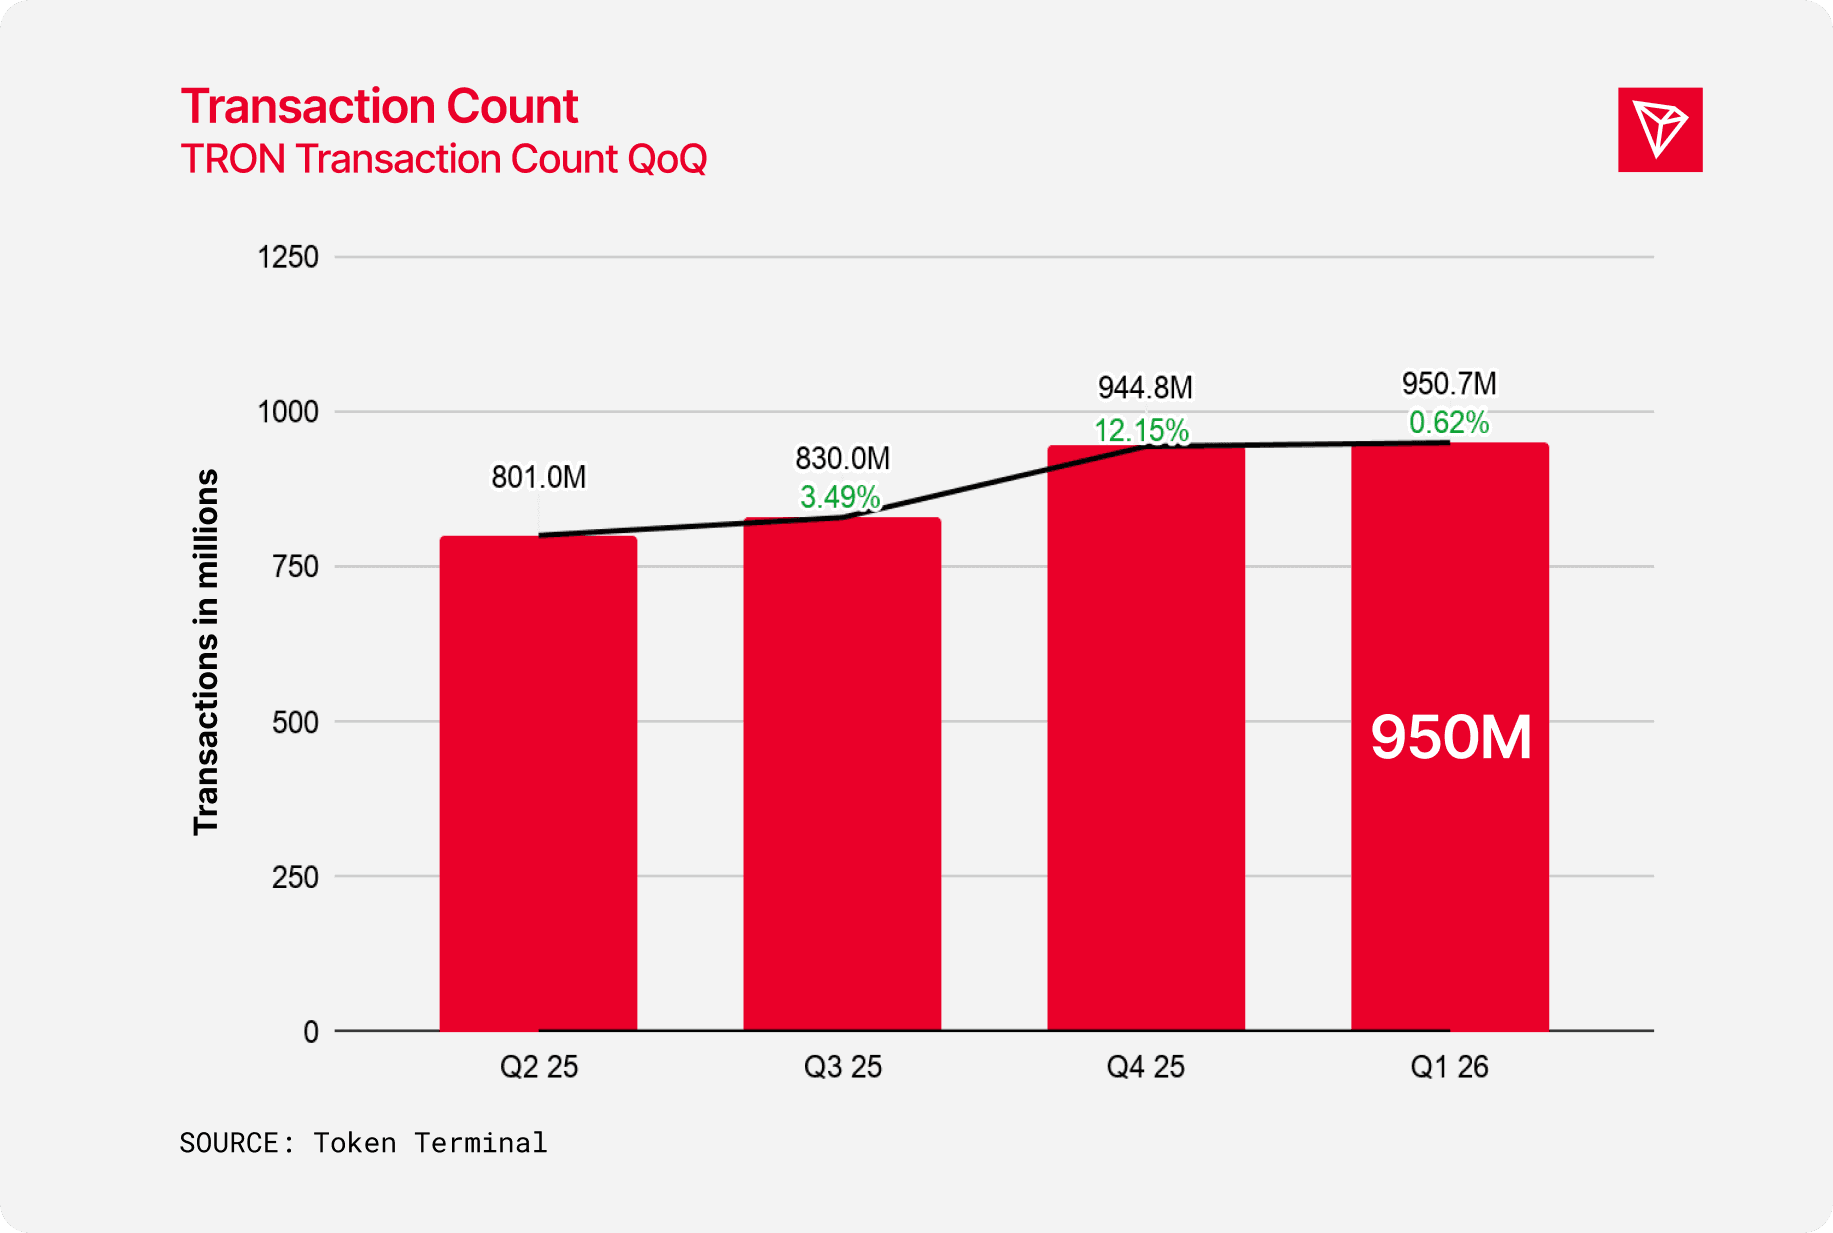
Transaction Volume and Count
TRON transactions saw a marginal increase of 0.62% QoQ.
This deceleration aligns with a broader "cool-off" period affecting the blockchain industry, coupled with external geopolitical factors contributing to slower financial activity. Despite this, the TRON network continues to stay consistent and as a reliable blockchain.
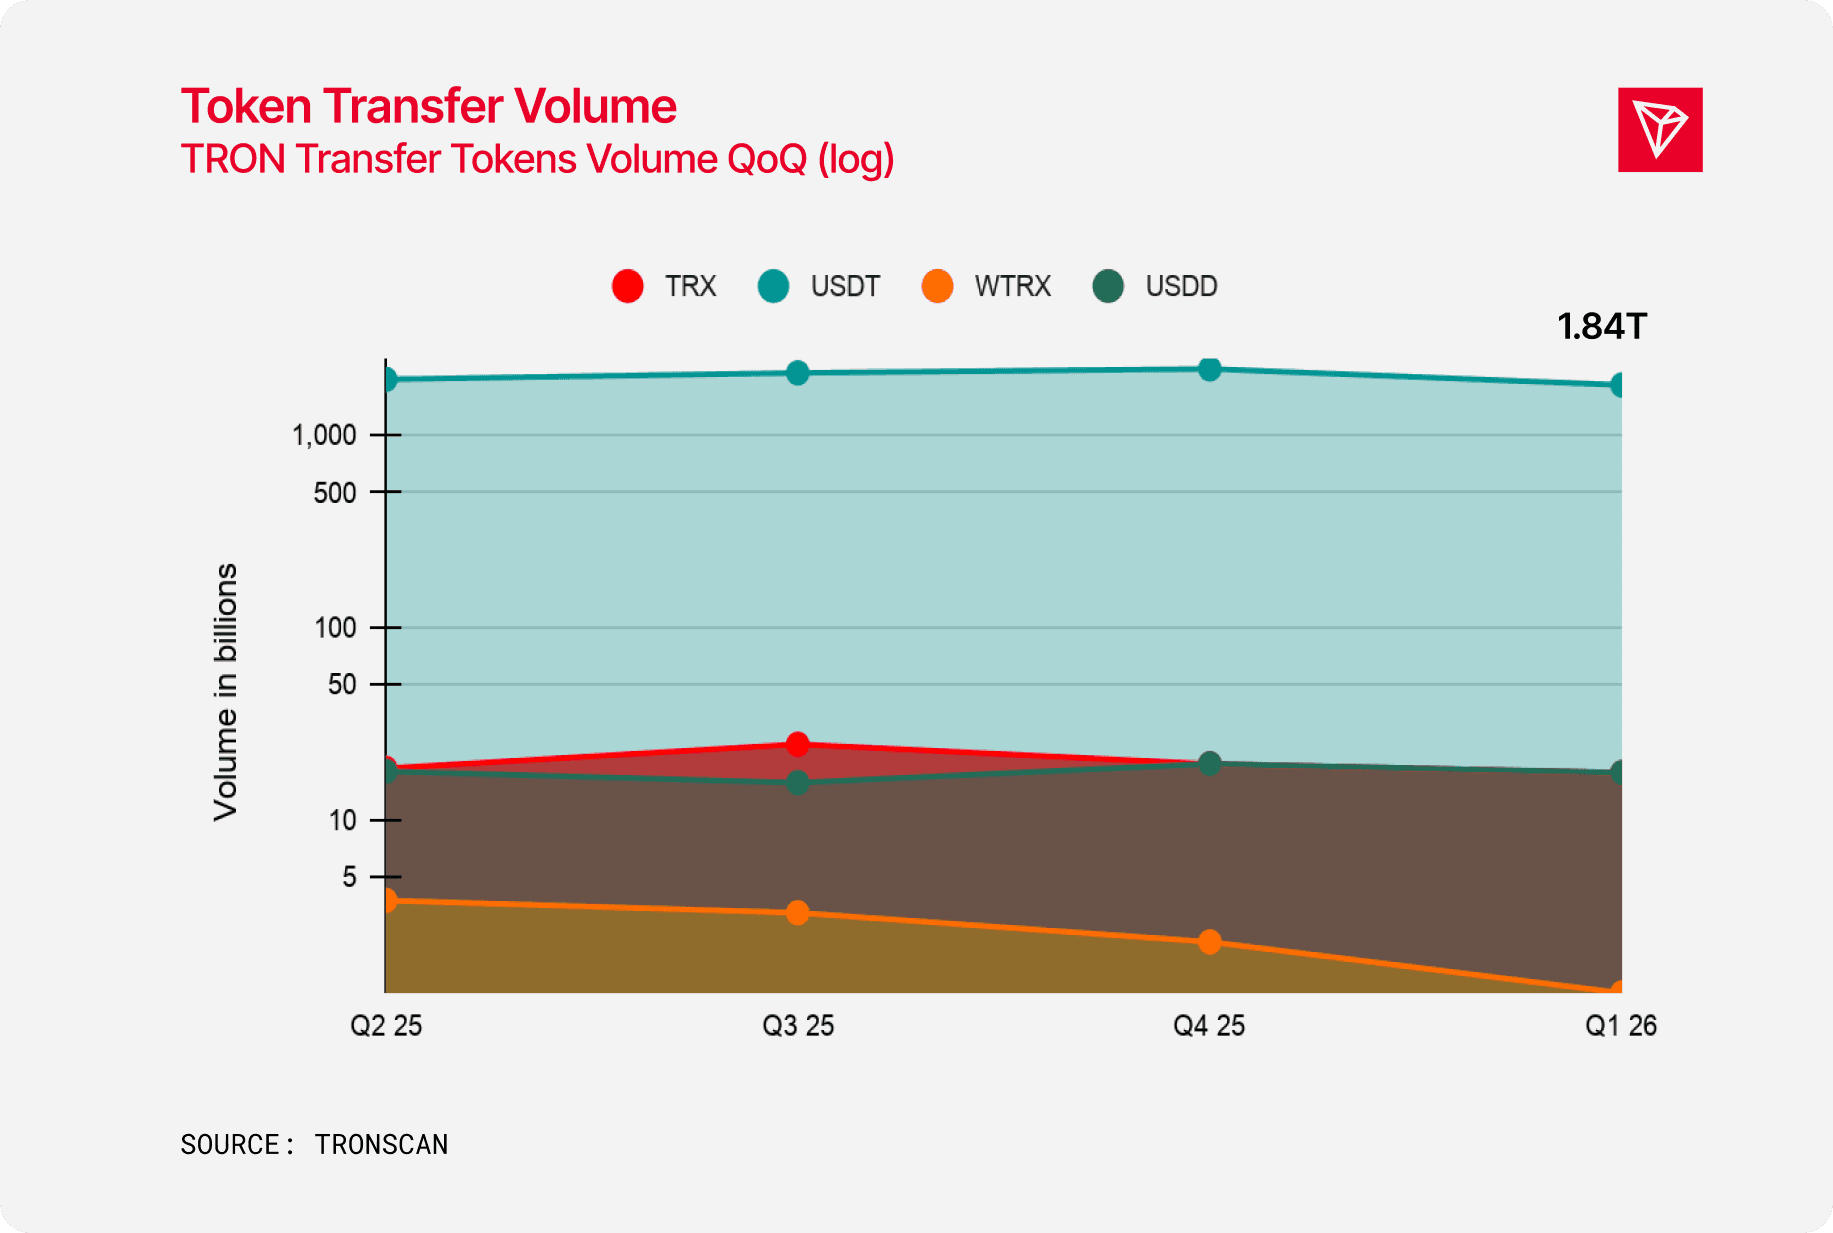
Top Performant Tokens by Transfer Volume
USDT remains the top token by trading volume.
Q1 saw a cooling period due to post-cycle exhaustion, geopolitical tension, and leverage unwinding, which reduced speculative activity. Nonetheless, the TRON network remains a top blockchain in regards to volume amid volatile times.
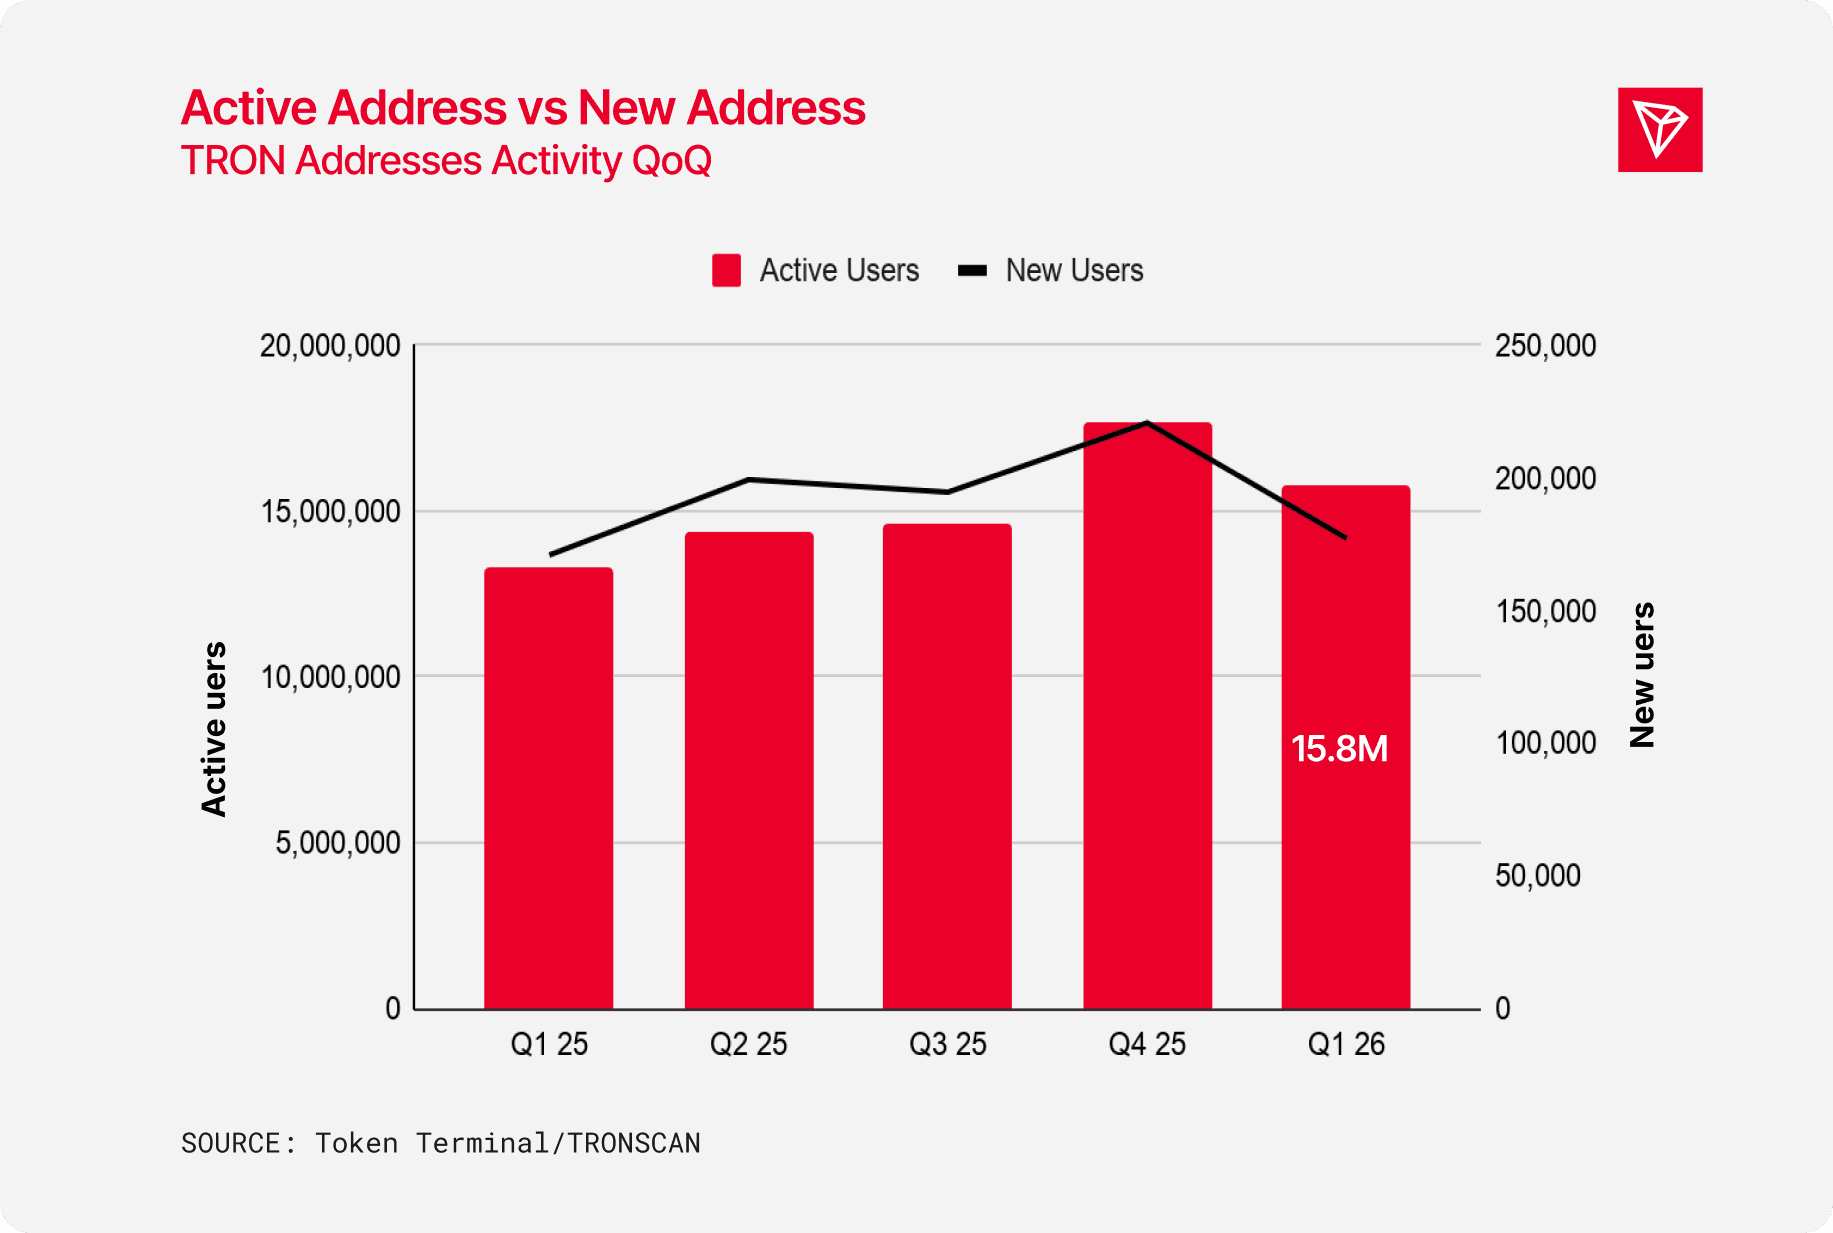
Address Activity
In Q1 2026, a decline was observed in both active addresses and new user acquisition.
This downturn may be attributable to the typical post-holiday decrease in activity, coupled with persistent broader geopolitical uncertainty. Compared to Q1’25, the TRON network has seen positive growth among its global users.
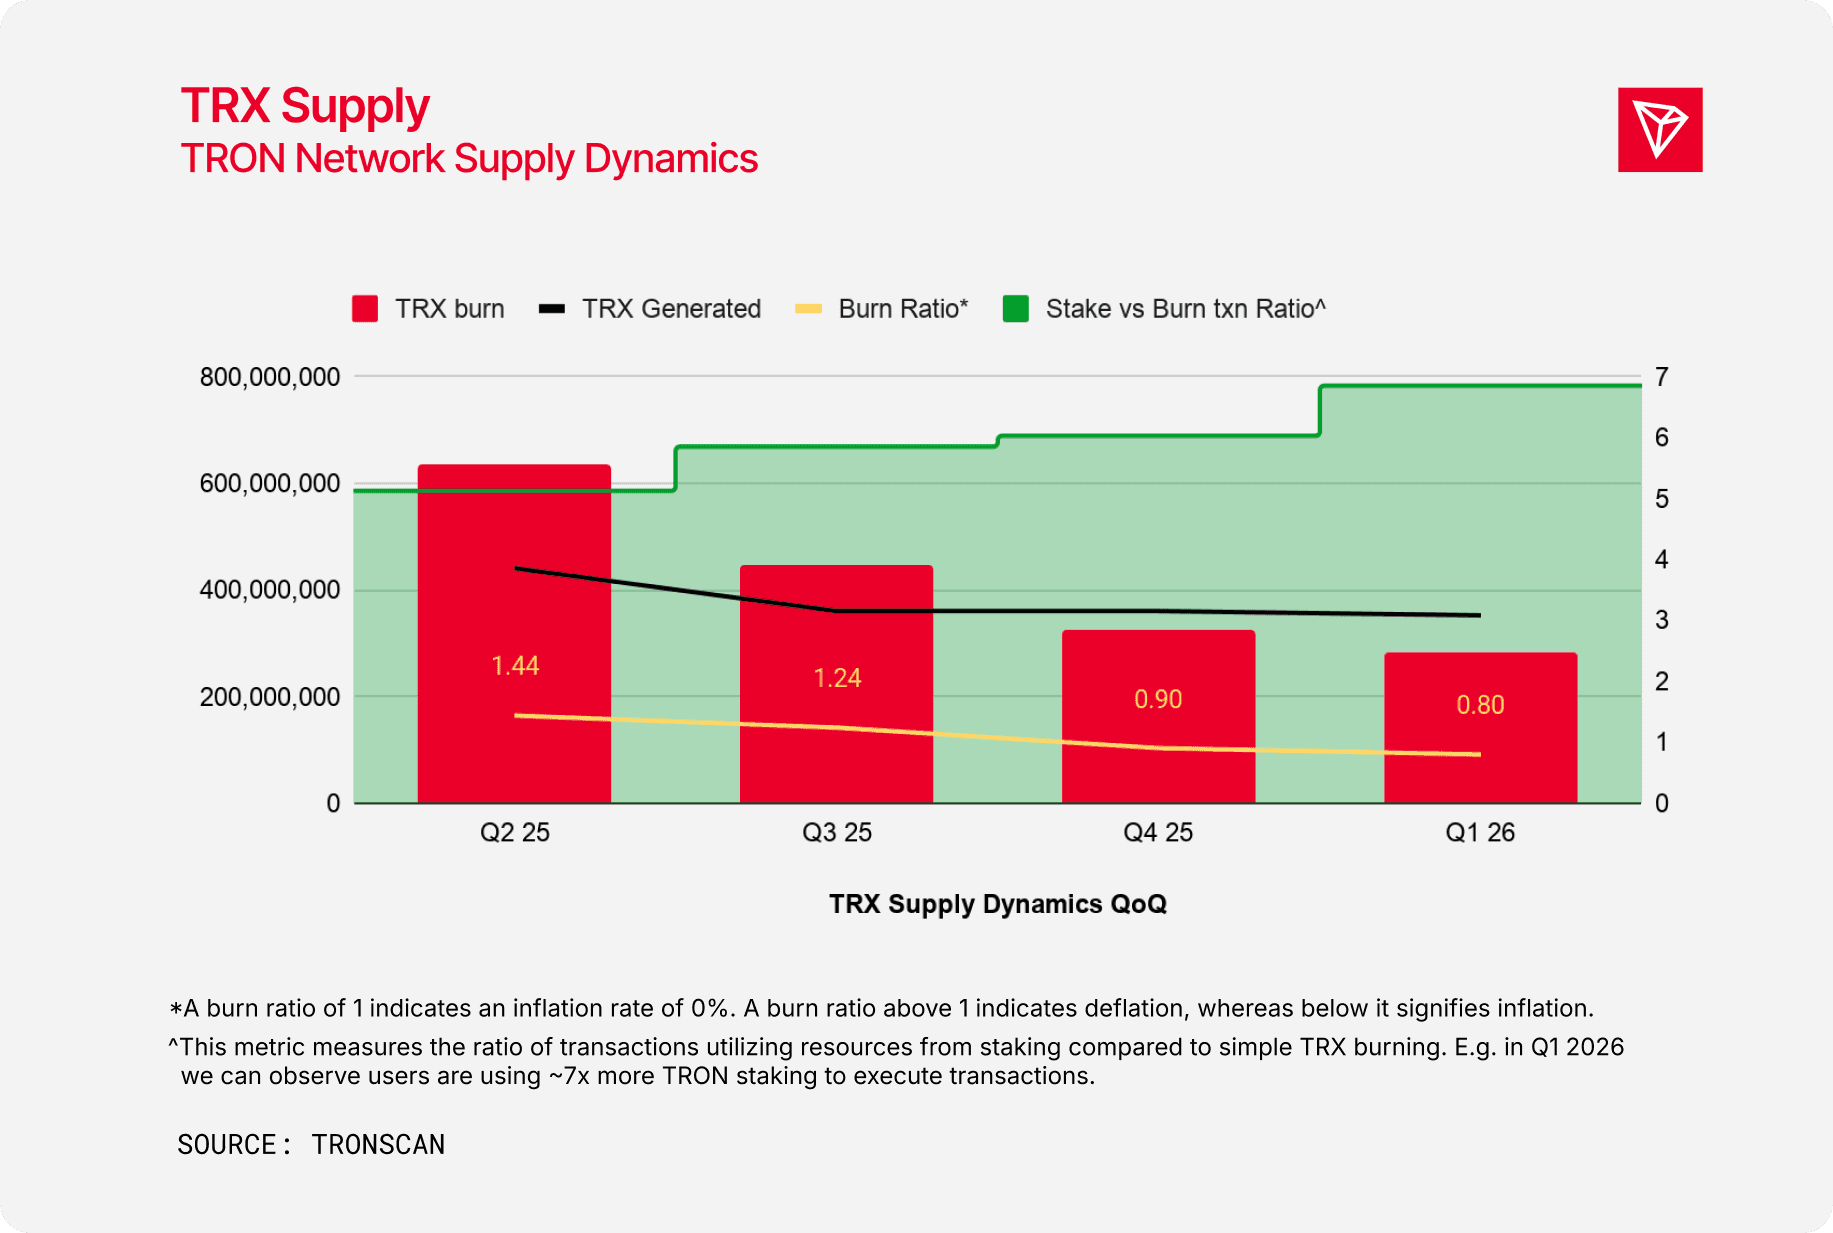
TRX Supply Dynamics
A 11% decline in the TRX burn ratio was observed, primarily originated from TRON users increasingly opting for staking over burning TRX for transaction fee reduction.
Revenue
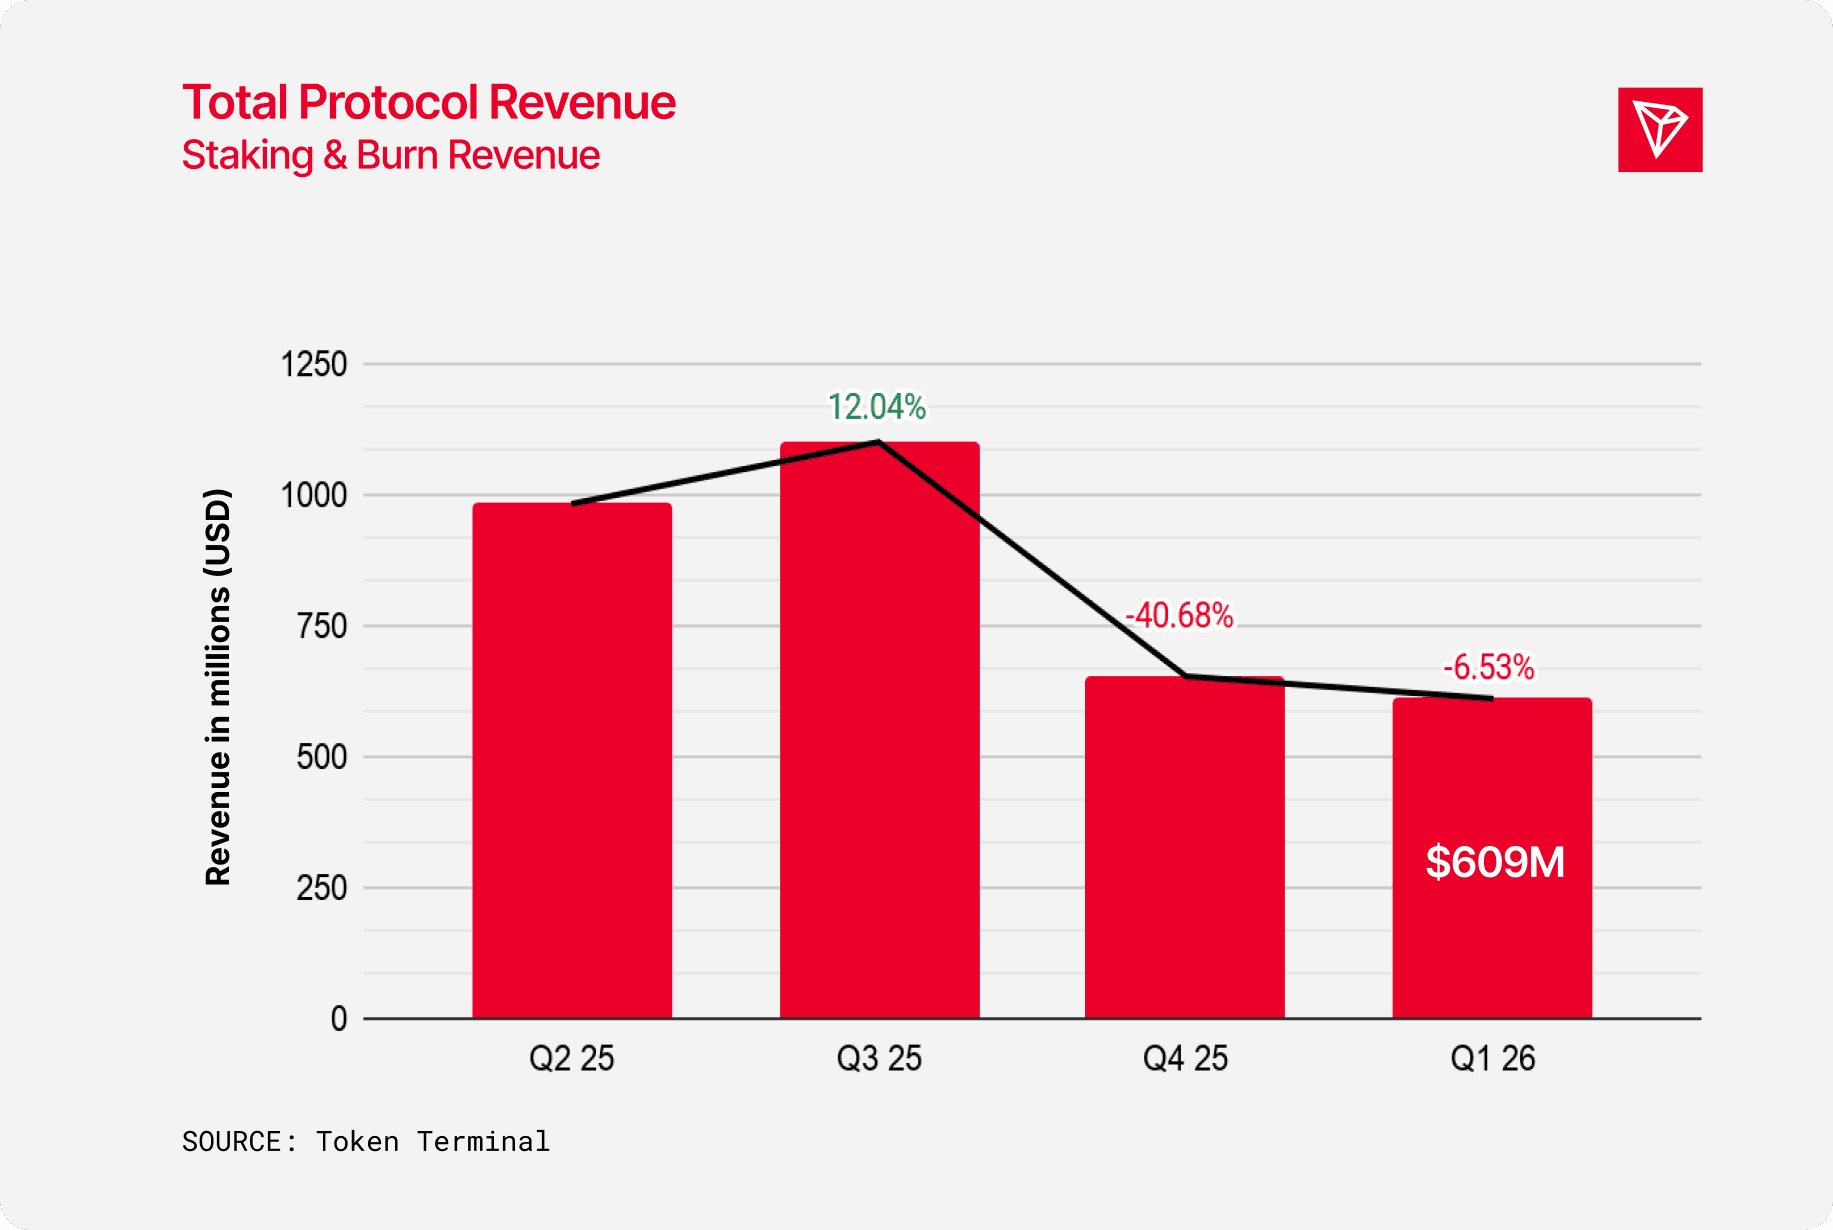
TRON's revenue has stabilized near $600M.
The 6.5% QoQ decrease is primarily attributable to a broader deceleration in the crypto industry activity, which has led to a reduction in stablecoin transactions and overall user activity. In comparison to other protocols in the industry, the TRON network still remains as a top performer in revenue.
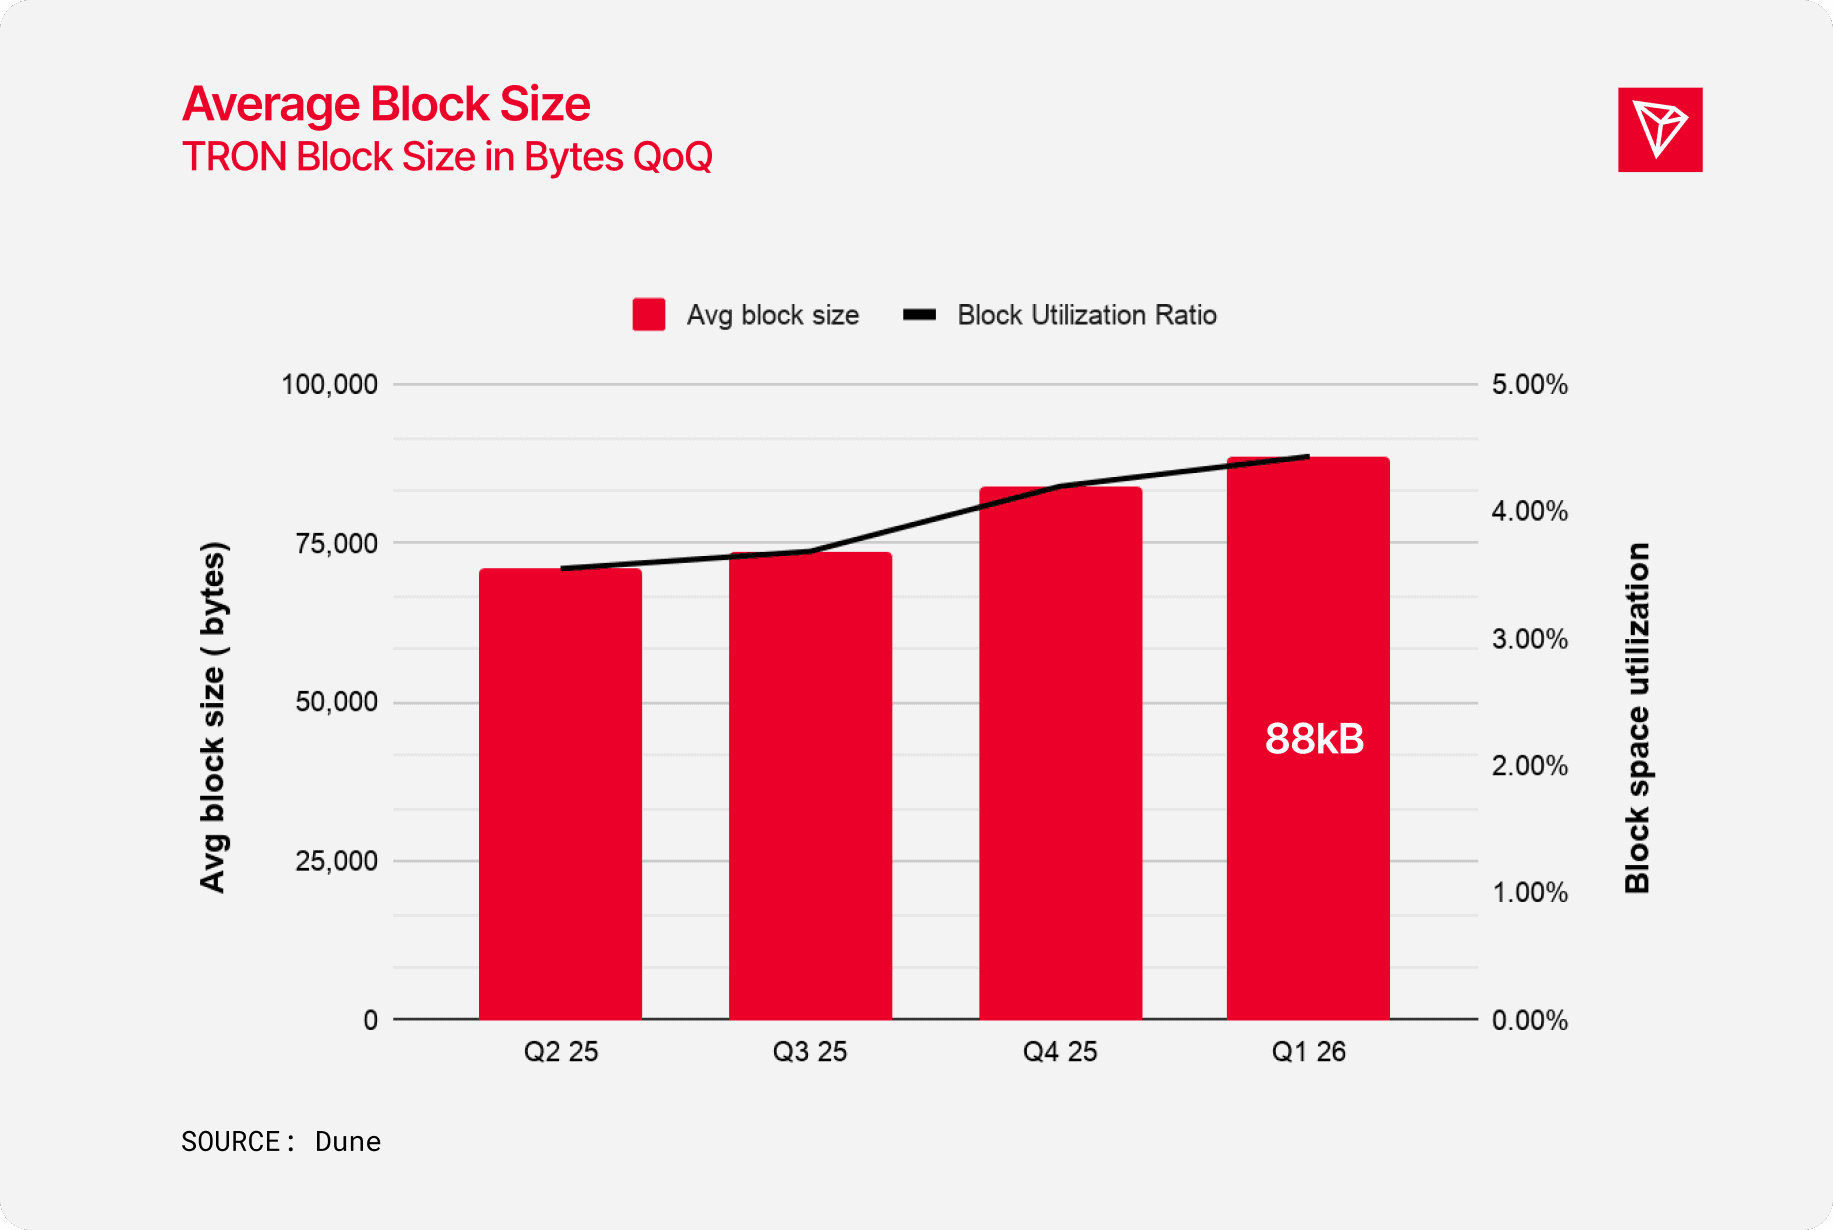
Block Space Utilization
TRON experienced a 5.6% increase on block size during Q1 2026, block size quantifies the total byte size of all transaction types included within a block, thereby serving as a metric for overall chain load and activity.
Theoretically, TRON possesses the capacity to increase its current transaction throughput by approximately twentyfold without negatively impacting the user experience.
Stablecoin Metrics
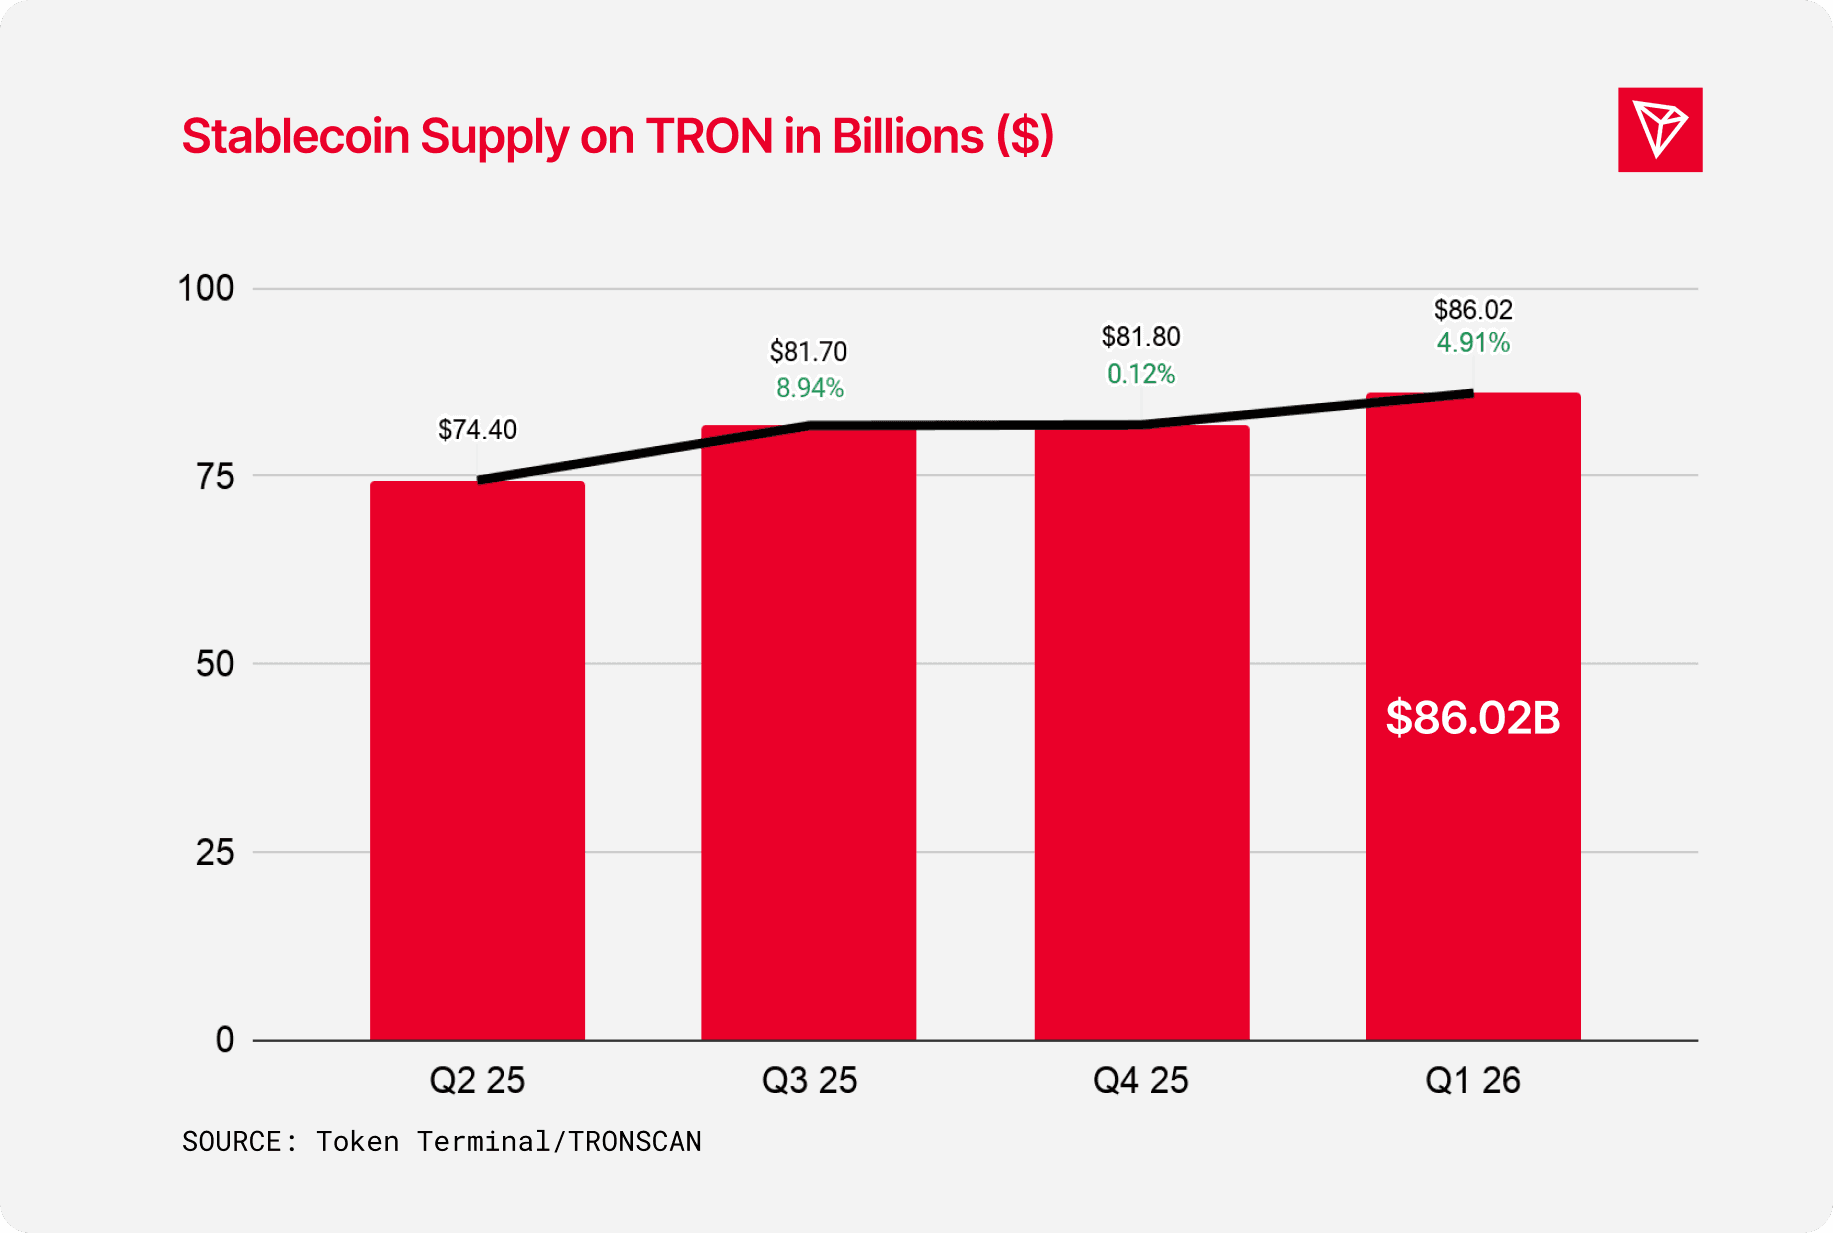
Stablecoin Supply
TRON’s stablecoin supply reached $86.02B in Q1 2026; the QoQ increase reflects strong market fluctuations, maintaining TRON’s position as a leading global blockchain network for stablecoins.
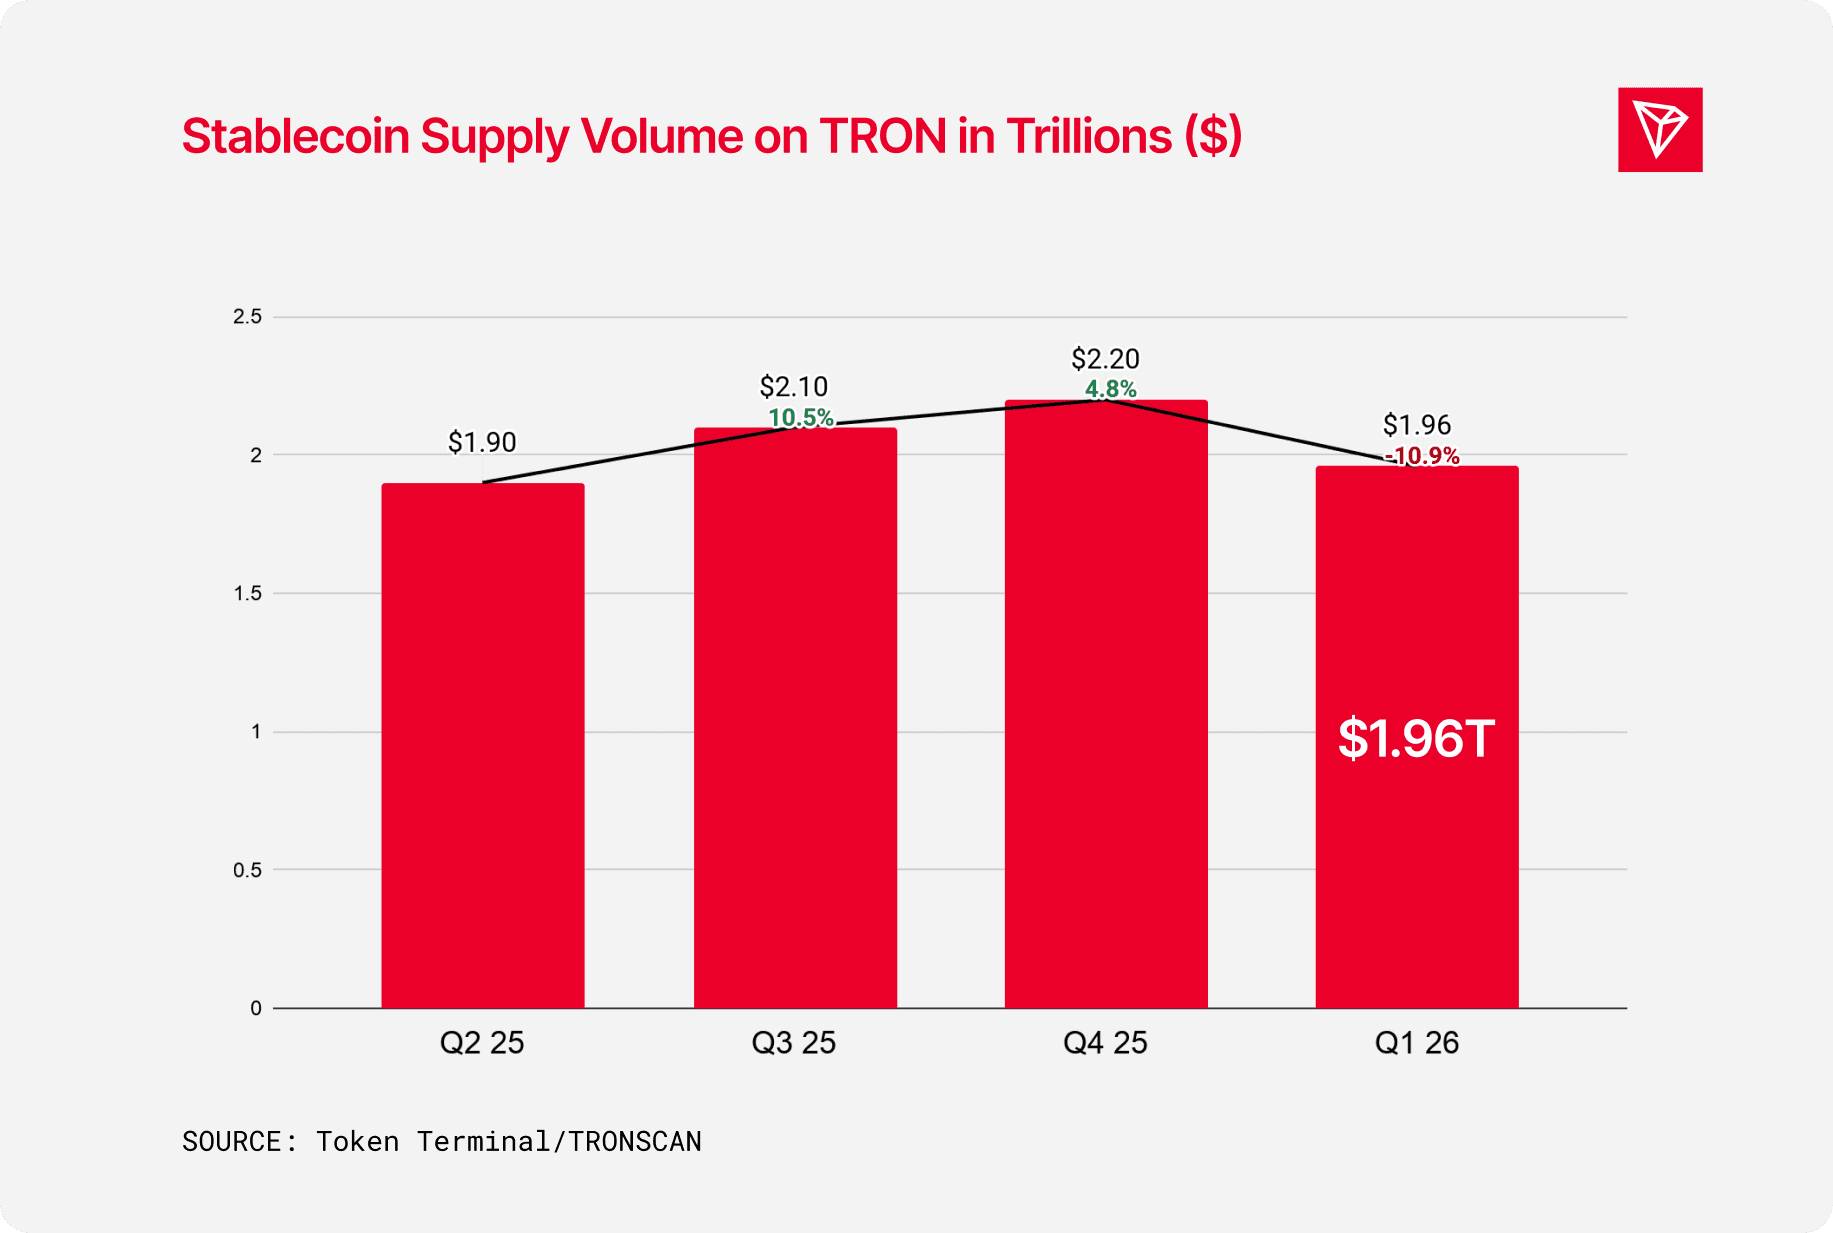
Stablecoin Settlement Volume
TRON’s stablecoin settlement volume reached $1.96T in Q1 2026, reflecting a decrease in activity due to market conditions. The broader amount reflects TRON’s dominance in real-world payments and cross-border value transfer. Usage highlights global adoption driven by low fees and high throughput.
DeFi and Liquidity Overview
Total Value Locked (QoQ)
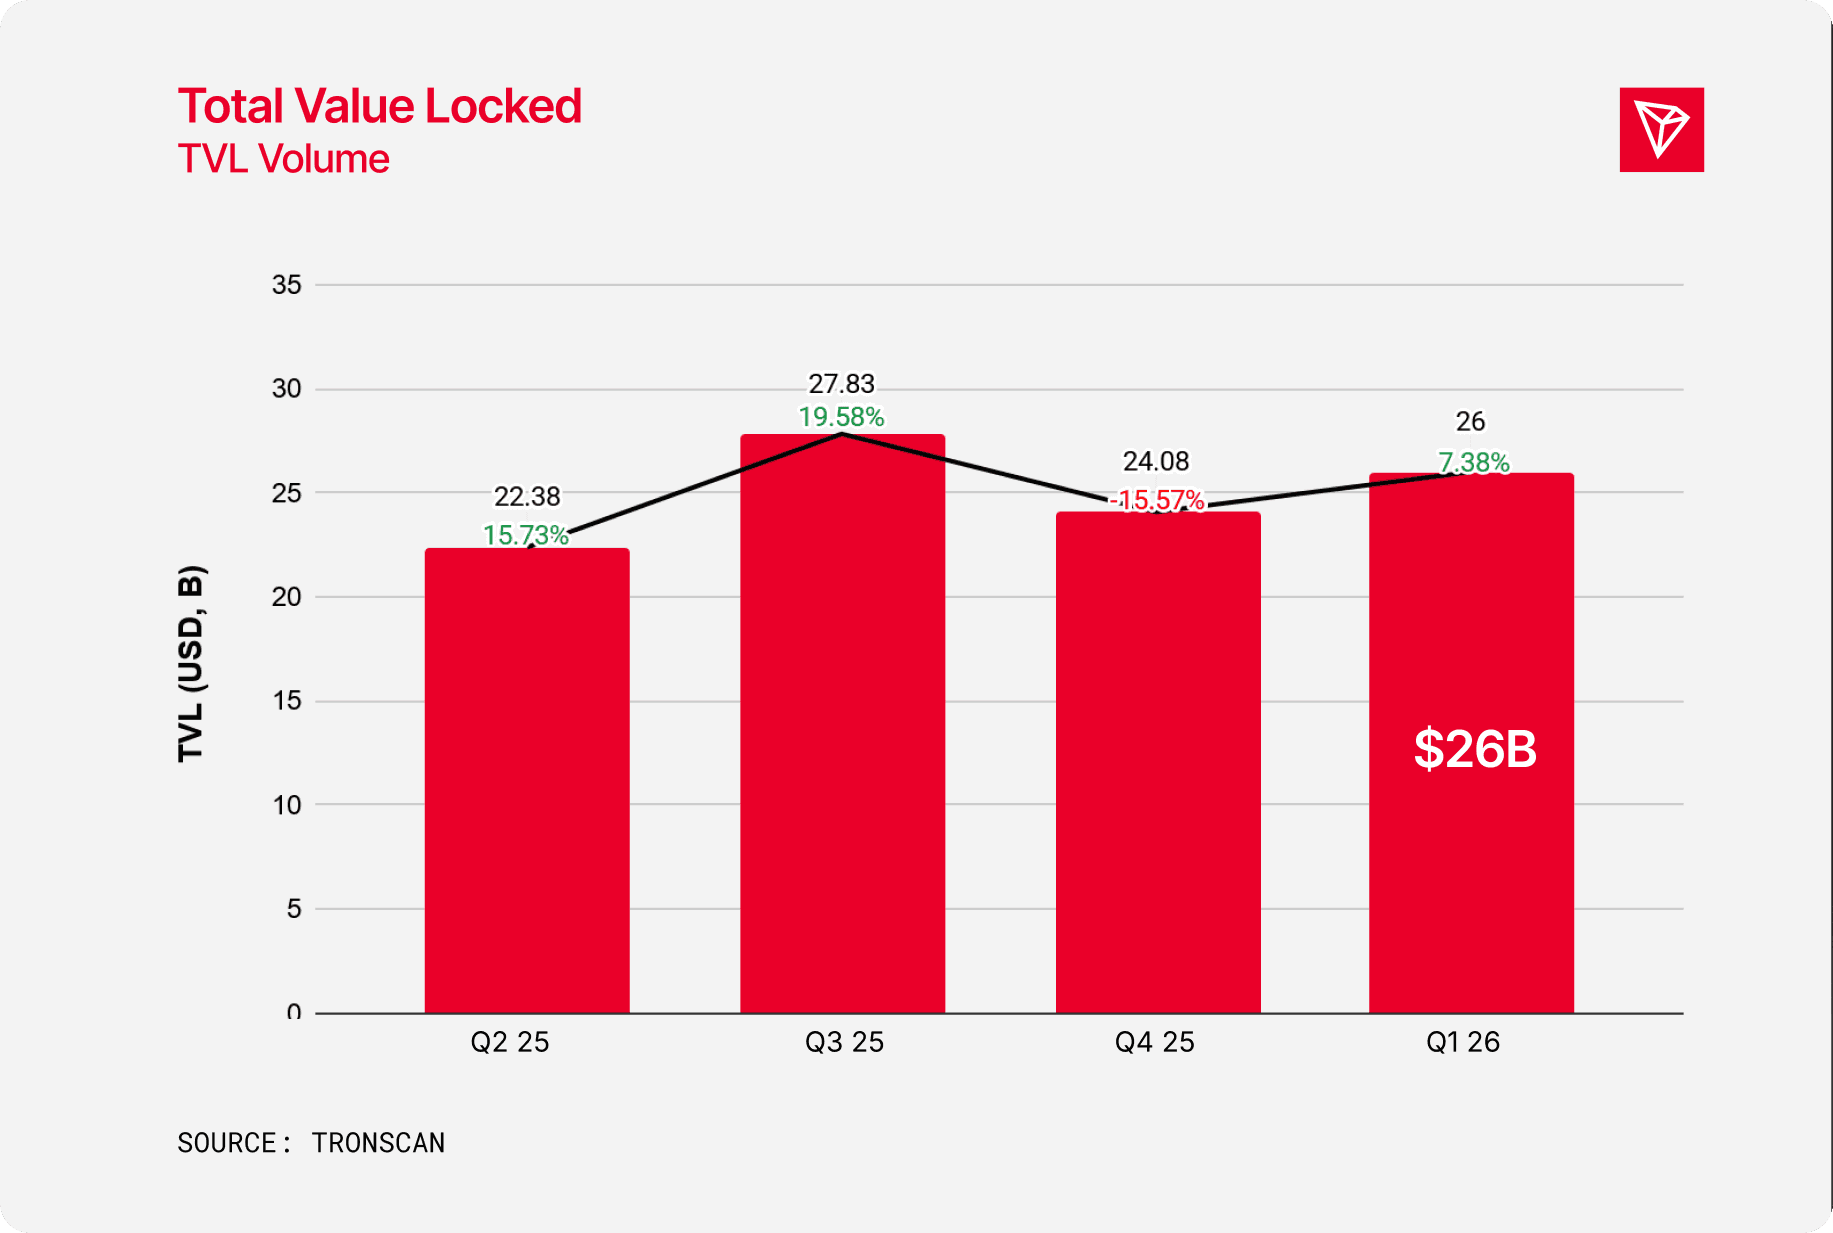
In Q1 2026, TRON TVL closed at $26.00B, up from $24.08B in Q4 2025, reflecting a 7.38% QoQ increase and signaling a solid rebound in DeFi and liquidity activity after the Q4 pullback.
Total Value Locked (YoY)
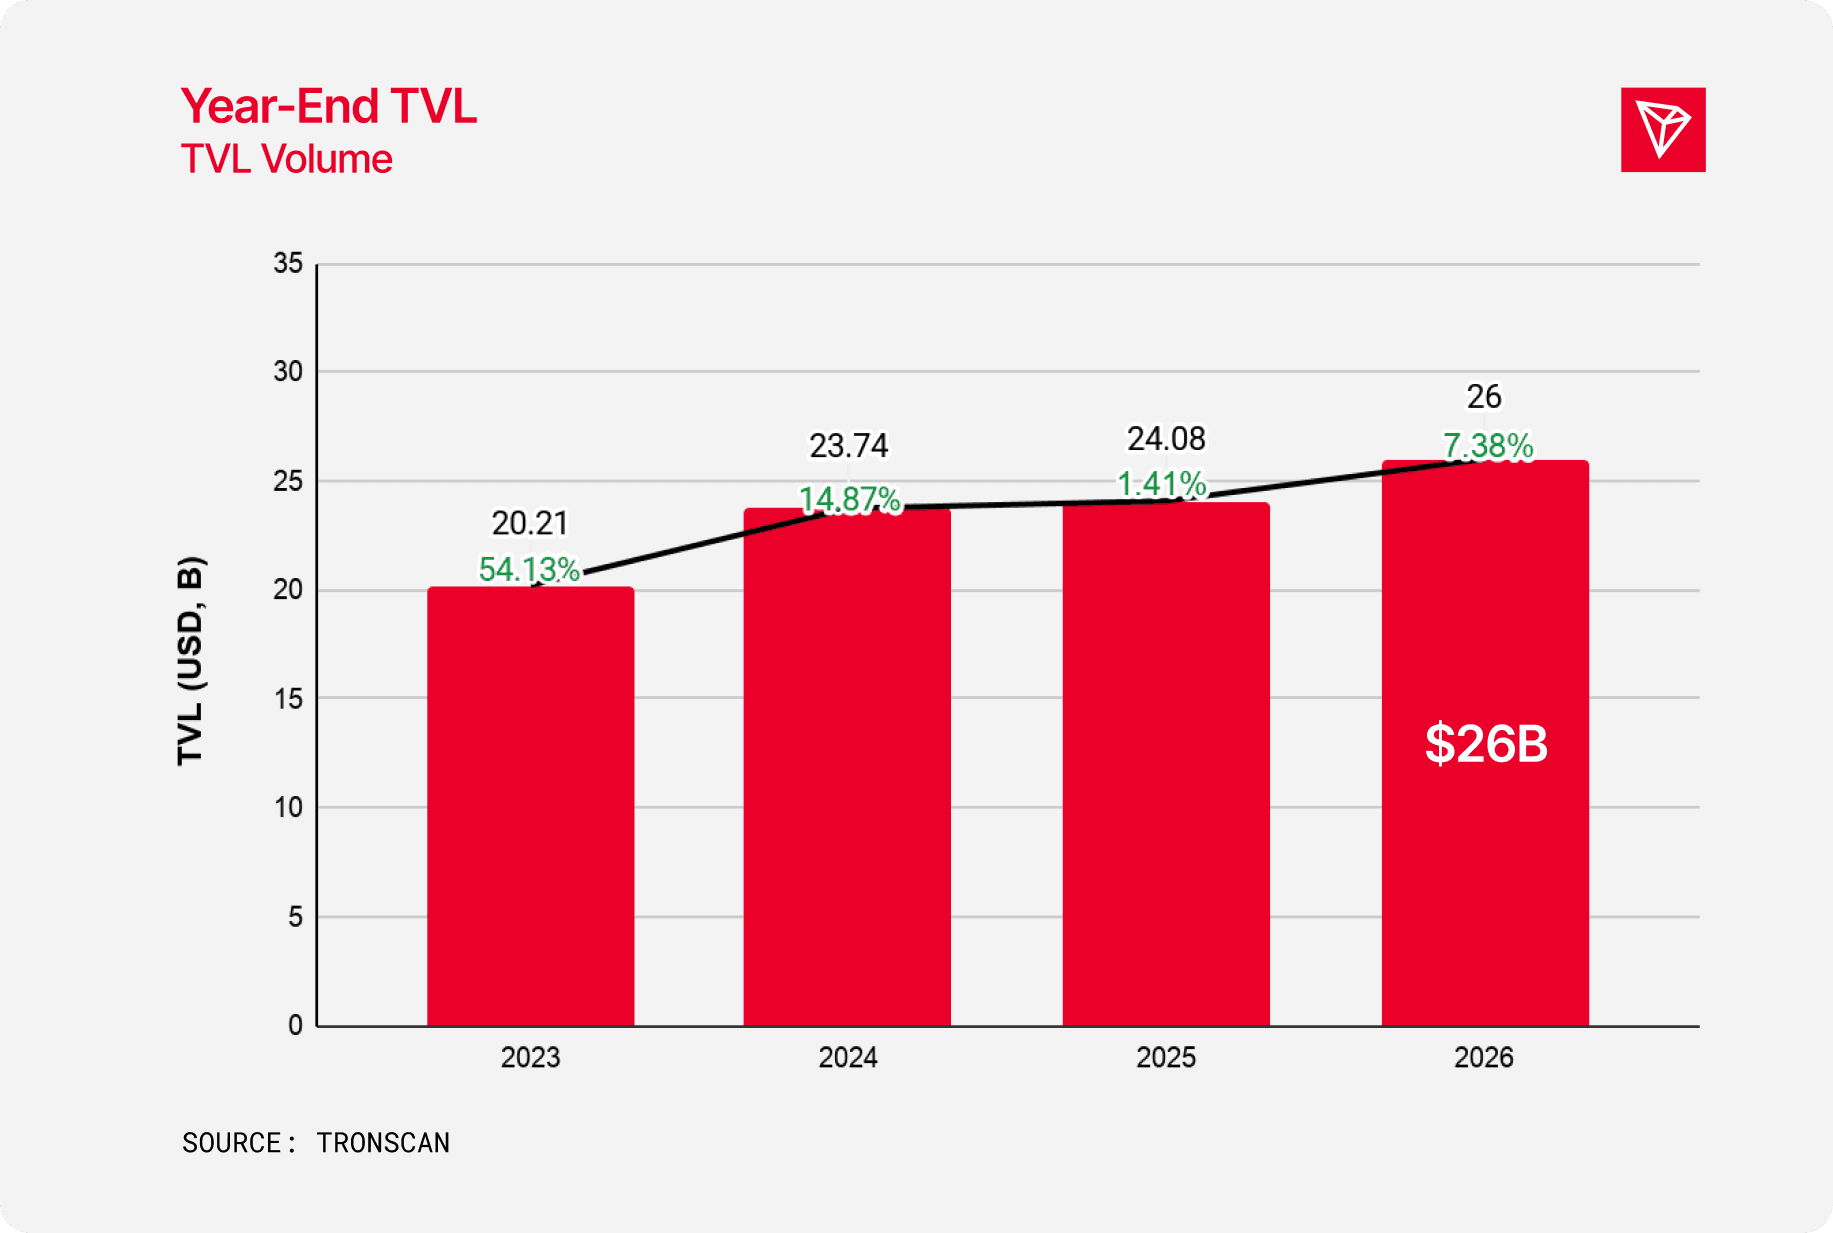
In 2026, TRON’s TVL reached $26.00B, up from $24.08B in 2025, representing a 7.38% YoY increase and reflecting renewed growth in DeFi and on-chain liquidity after a relatively flat 2025.
Protocol and Category Wise TVL Q1 2026
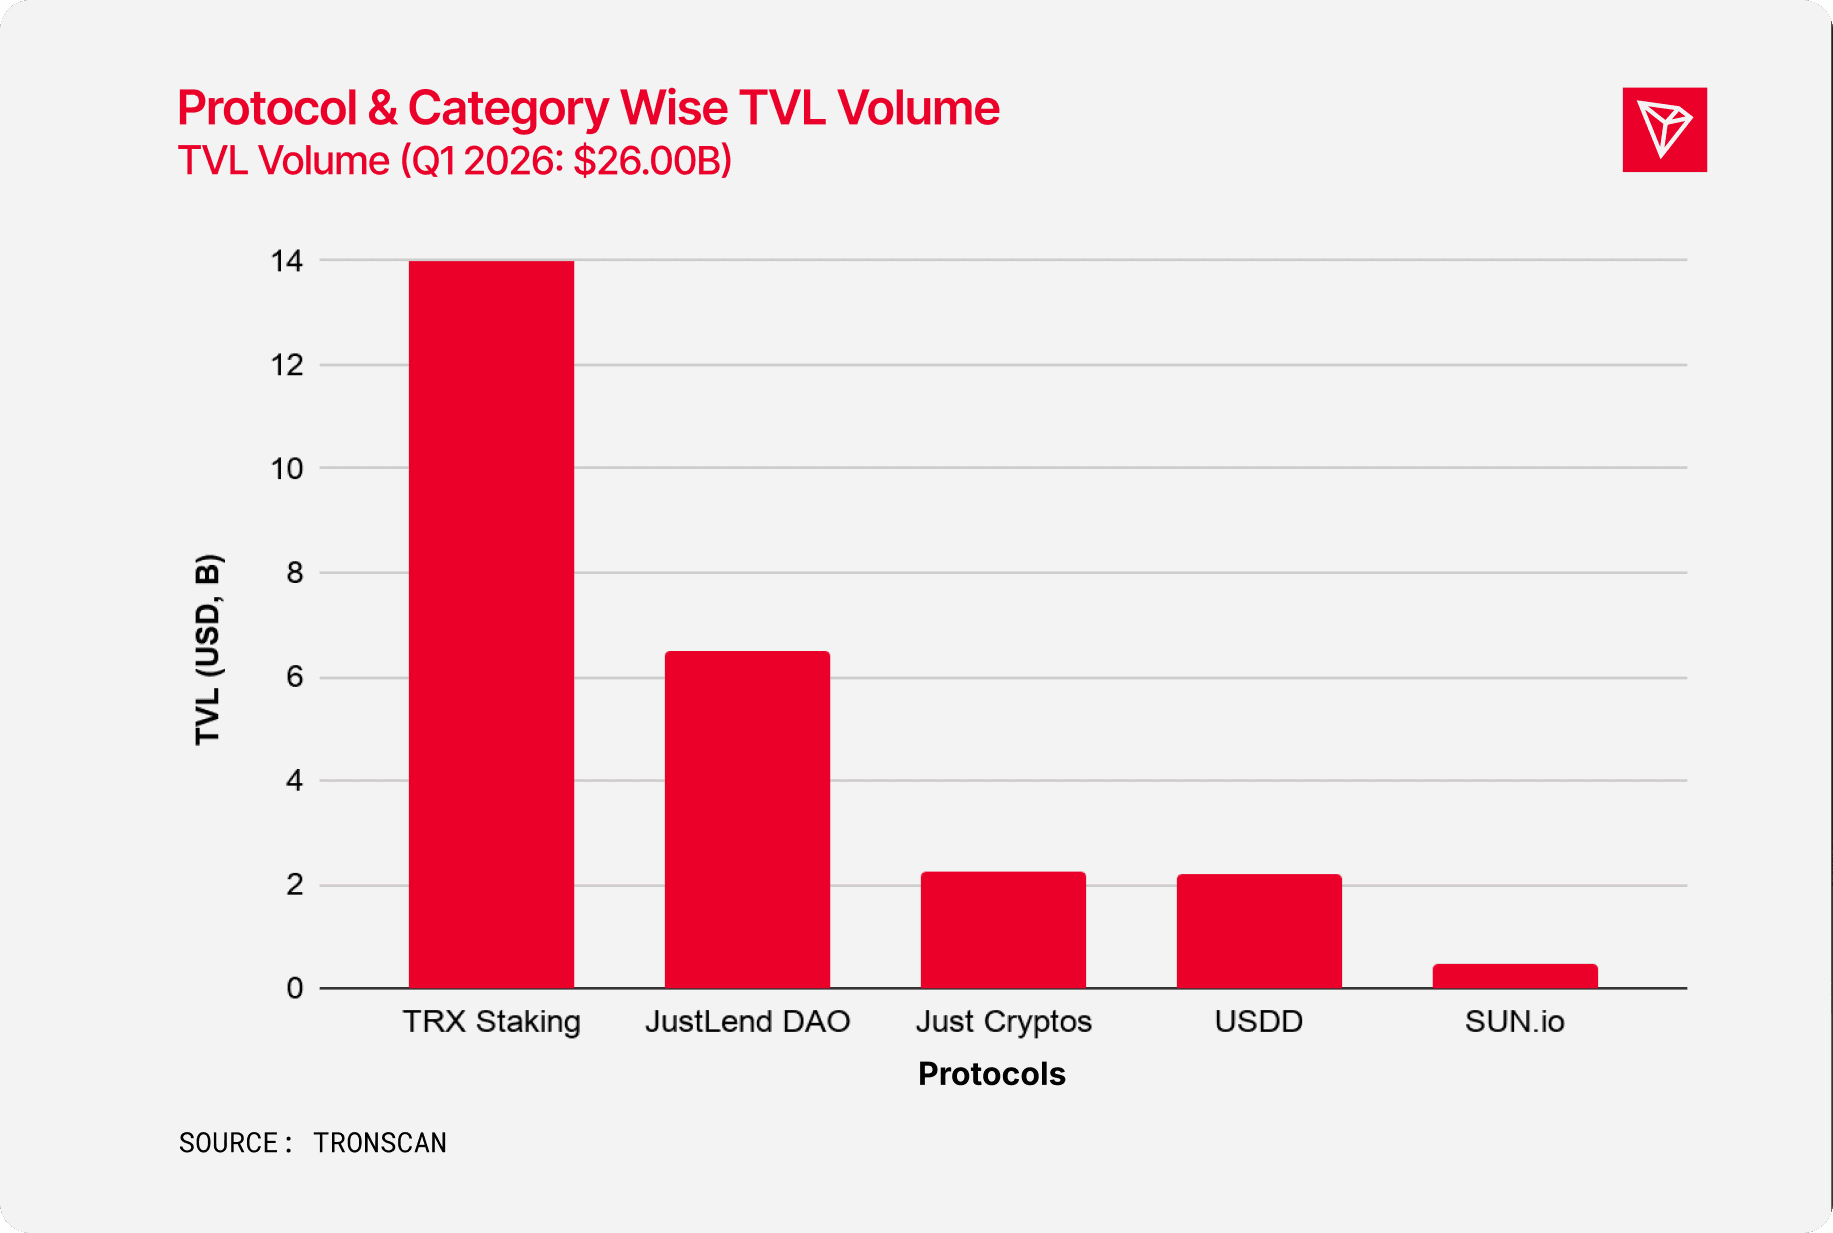
In Q1 2026, capital remained highly concentrated in core staking and lending protocols, led by TRX Staking ($14.50B) and JustLend DAO ($6.58B), while Just Cryptos ($2.24B) and USDD ($2.19B) formed a second tier and SUN.io ($0.49B) stayed comparatively smaller.
Market and Liquidity Matrix
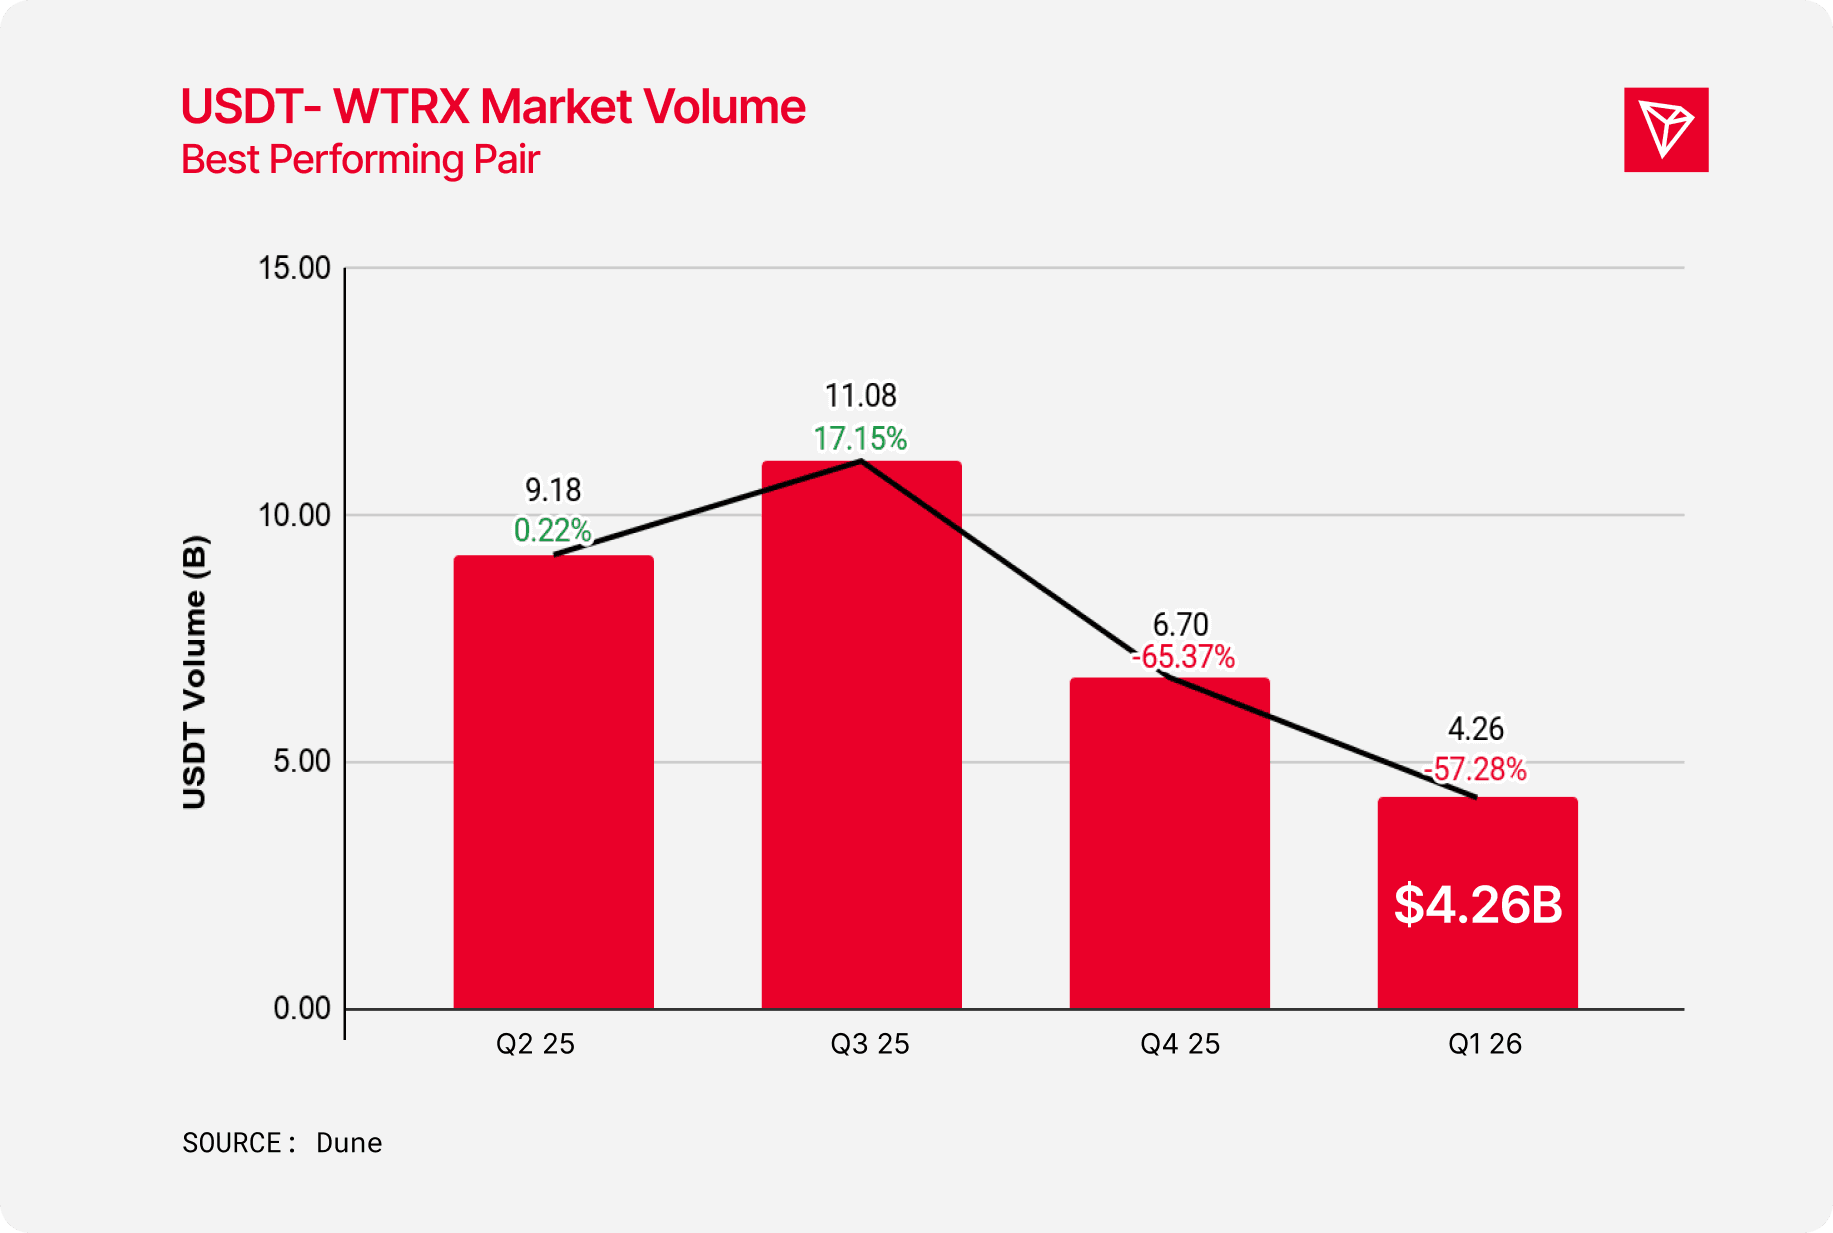
In Q1 2026, the total amount of USDT swapped in the USDT–WTRX pool on SunSwap was about $4.26B, down from $6.70B in Q4 2025 and well below the $11.08B peak in Q3 2025, indicating continued cooling in trading activity for TRON’s core pair and a further normalization after the strong mid-year surge.
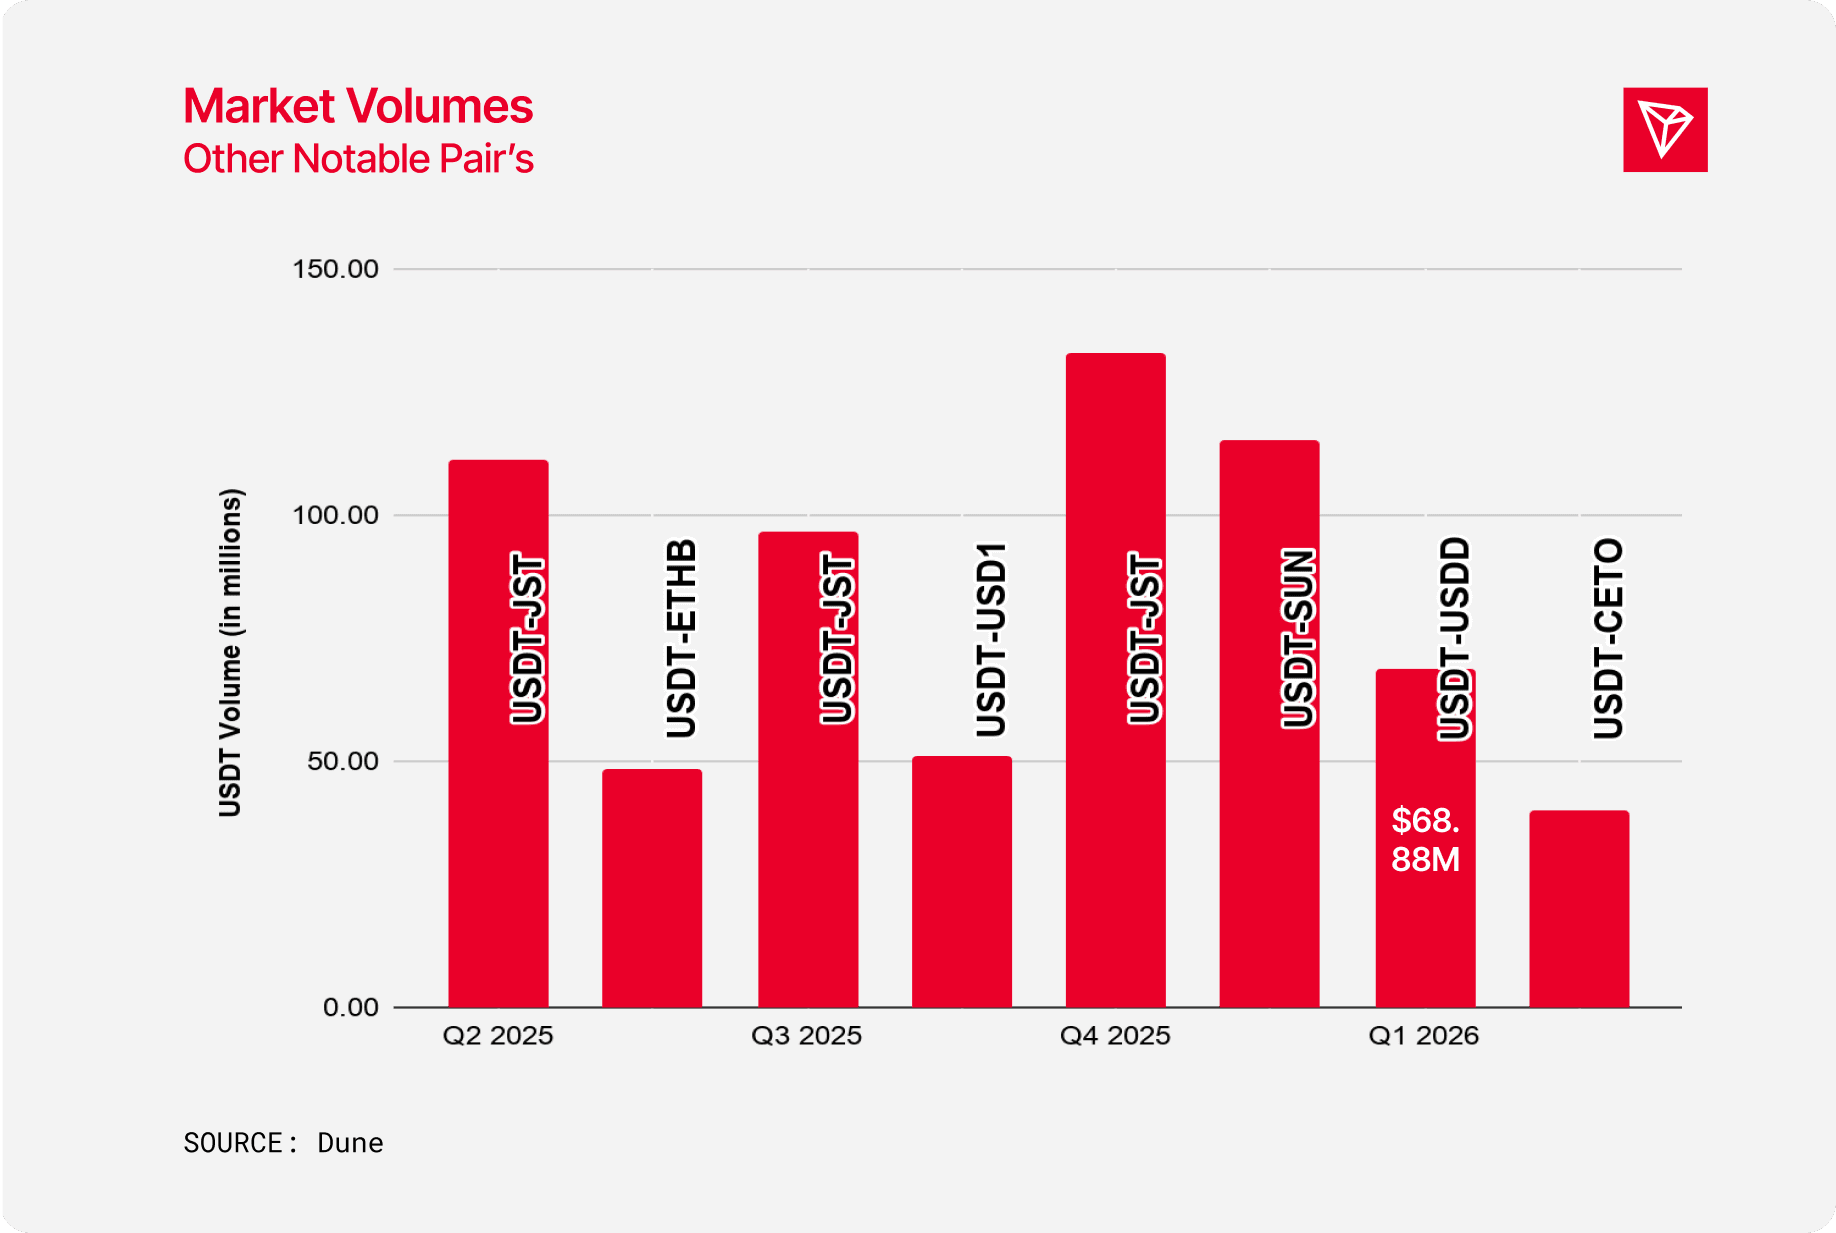
Top Performers in Each Quarter
In Q1 2026 (excluding USDT–WTRX), the top on-chain markets by USDT volume were USDT–USDD (~$68.88M) and USDT–CETO (~$39.98M), showing that trading activity outside TRON’s core pair was much smaller and more fragmented.
Tokenomics
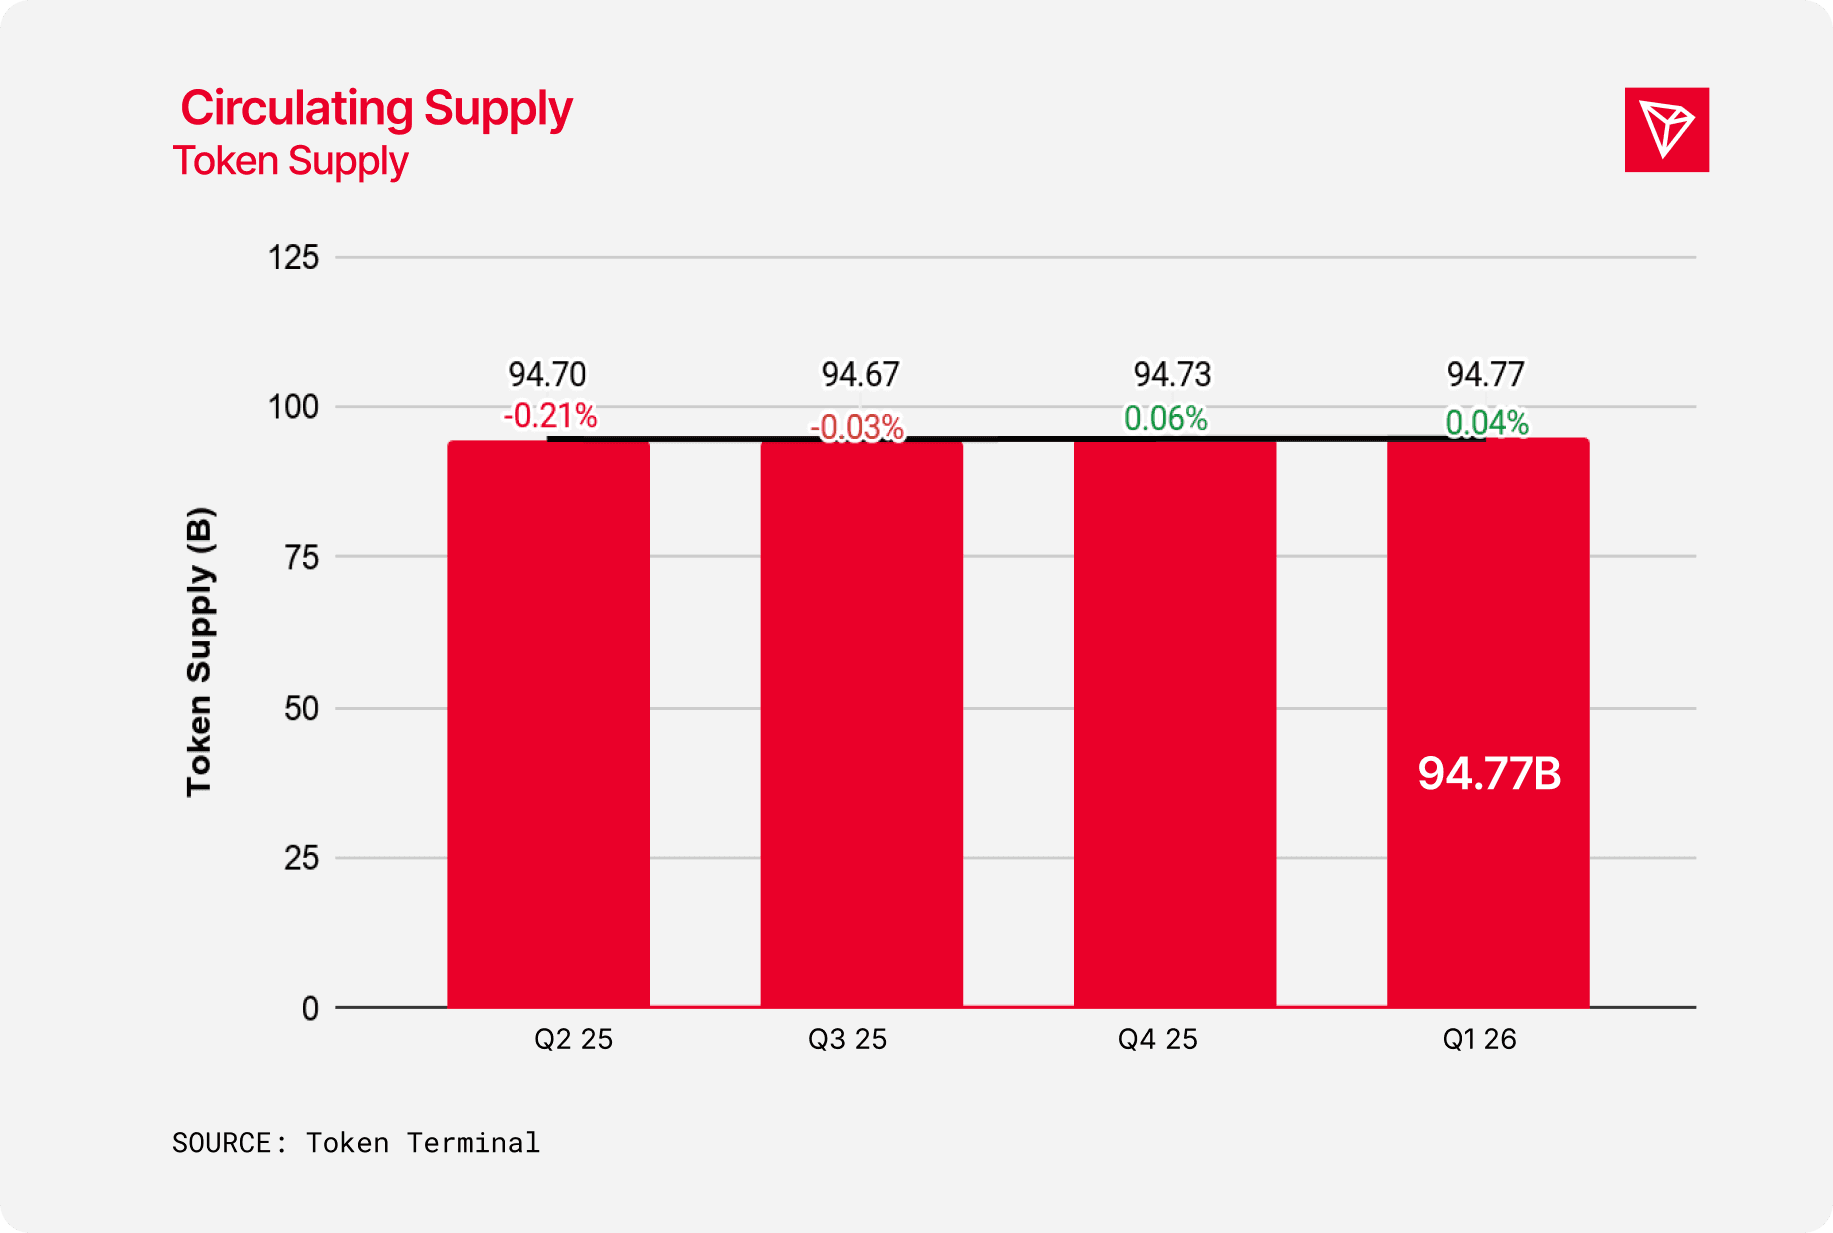
Token Supply and Distribution
In Q1 2026, TRON’s circulating supply edged up to 94.77B, a modest 0.04% QoQ increase, indicating supply remained broadly stable.
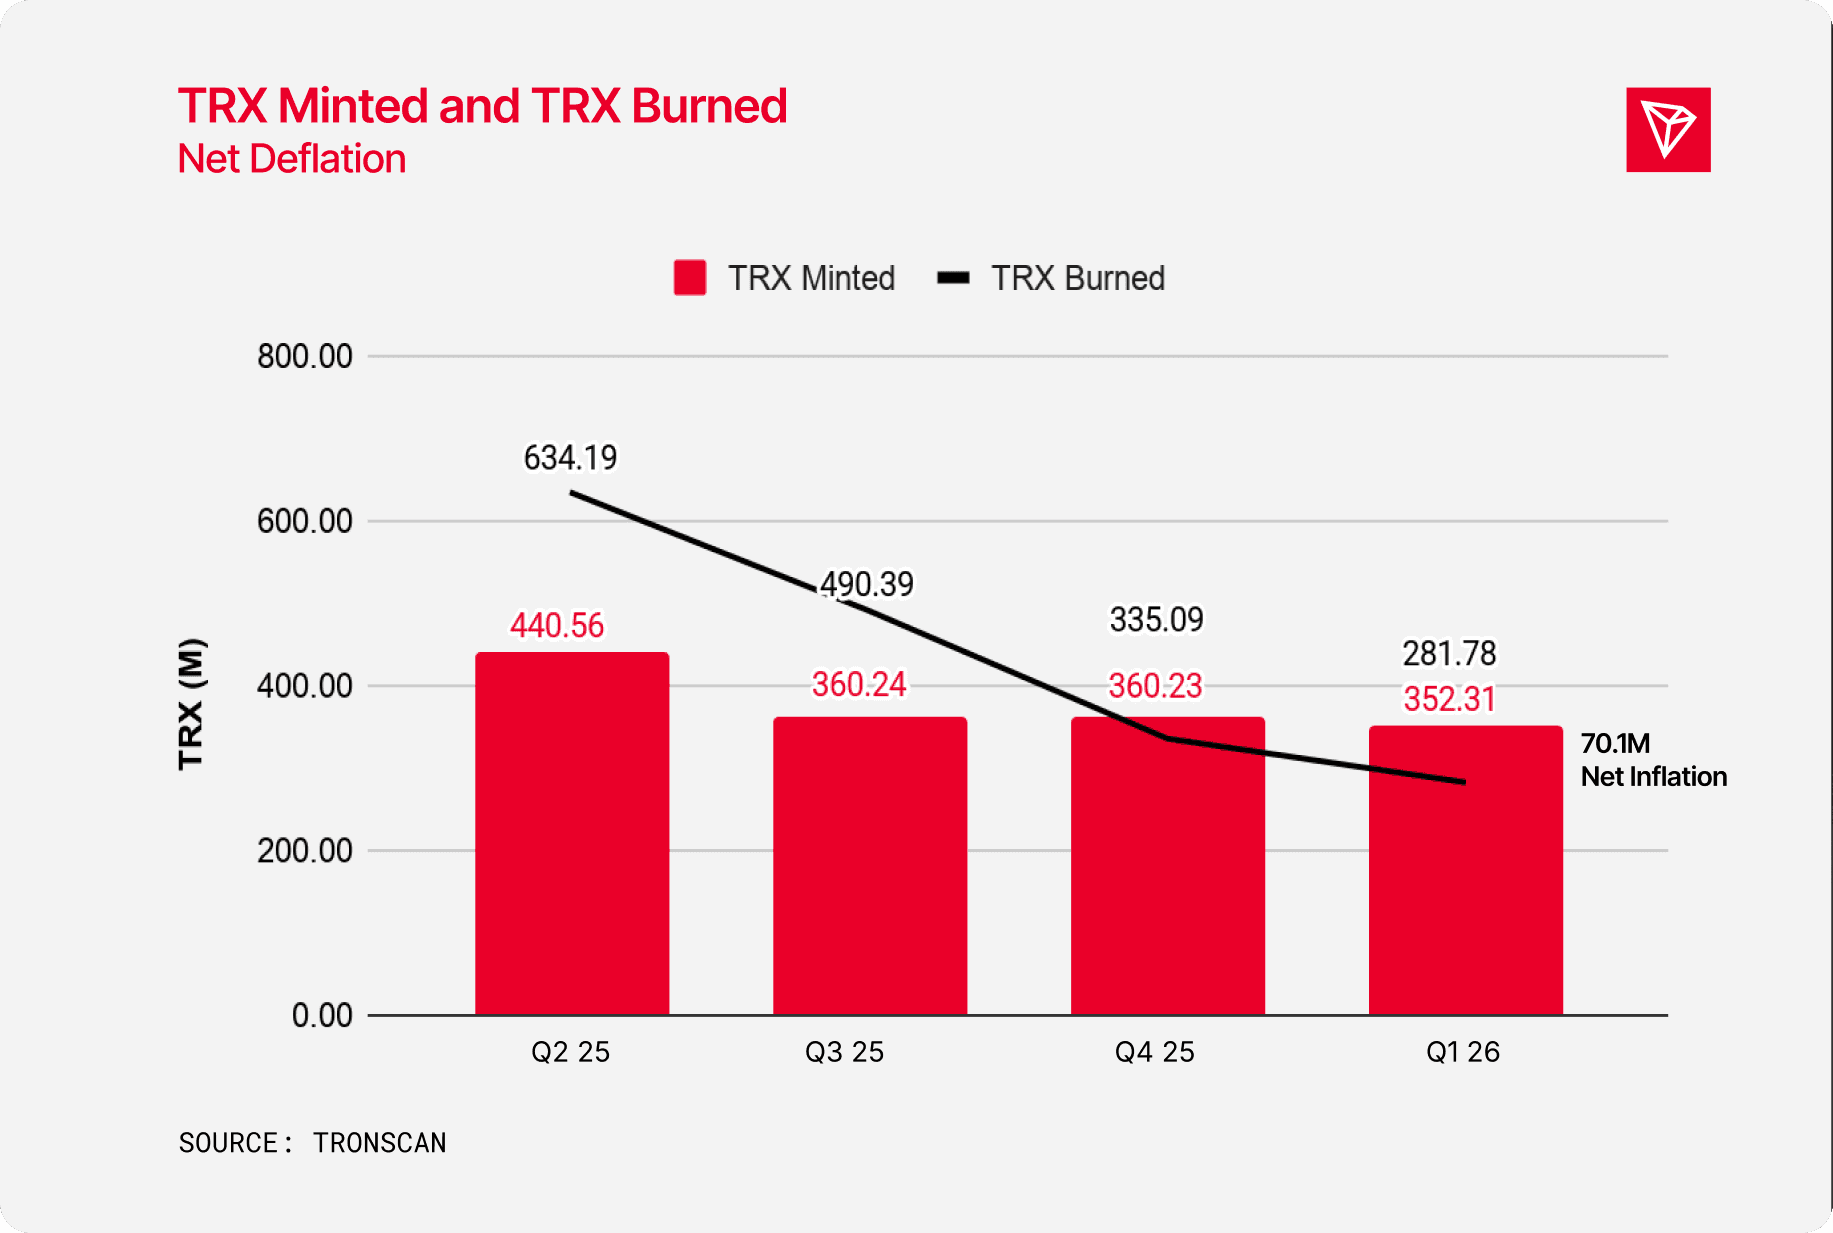
TRX Monetary Policy - Mint / Burn (Net Deflation)
In Q1 2026, TRON remained net inflationary, with ~352.3M TRX minted versus ~281.8M TRX burned, resulting in ~+70.5M TRX net issuance for the quarter. Compared with Q4 2025’s +25.1M, this reflects a larger inflationary gap, driven by lower burn relative to issuance.
Ecosystem Integrations
Developer Ecosystem Growth
Smart Contracts
TRON core developer activity is the cornerstone for future enhancements to the tron protocol implementation.
A 30% growth in commits QoQ signals a growing interest and commitment from the TRON developer community to execute improvements on TRON.
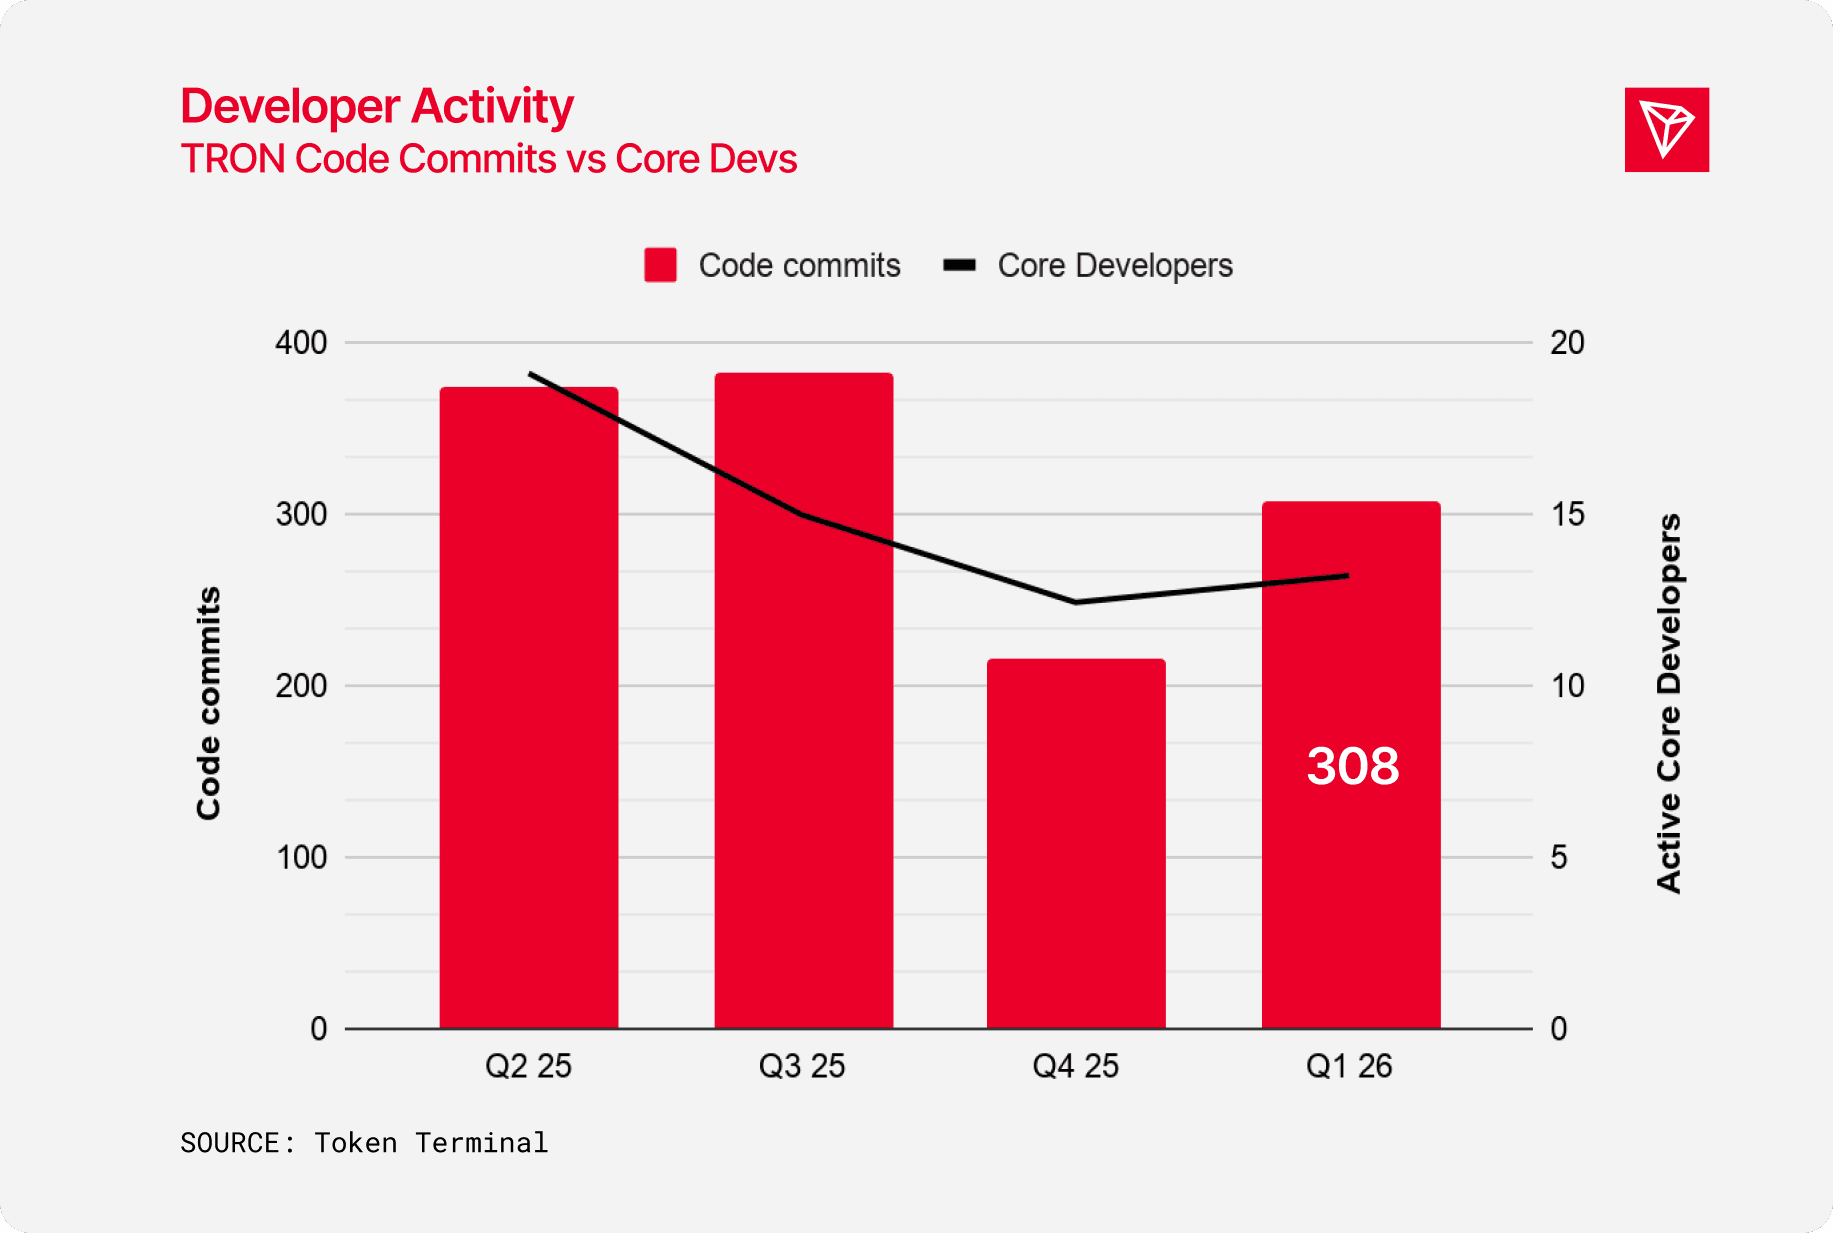
Developer on-chain activity demonstrated sustained QoQ growth, contrasting with a broader deceleration within the crypto industry.
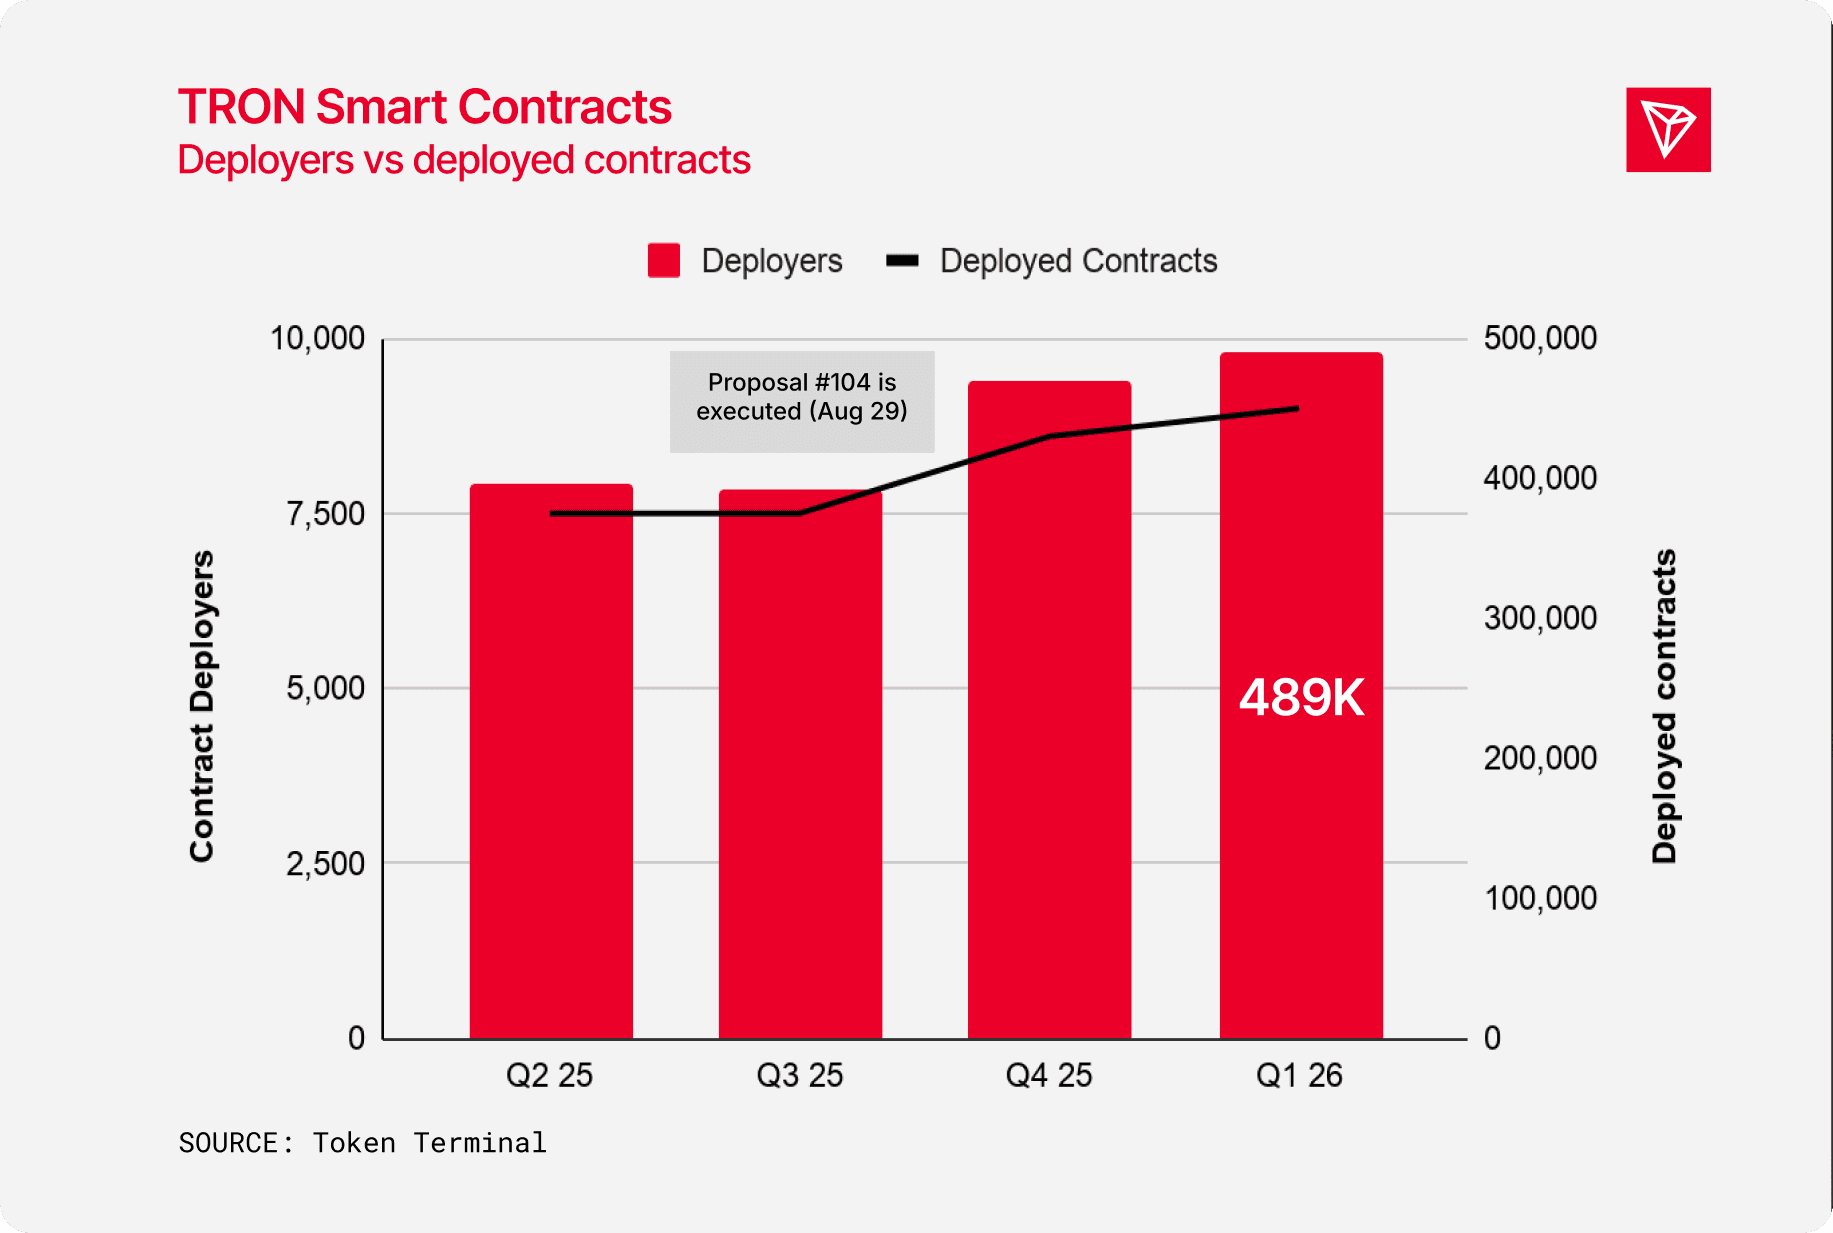
This trend is likely attributable to factors such as Ecosystem expansion, recent integration initiatives, and the implementation of proposal #104, which resulted in an approximate 60% decrease in smart contract deployment costs.
Governance & Decentralization
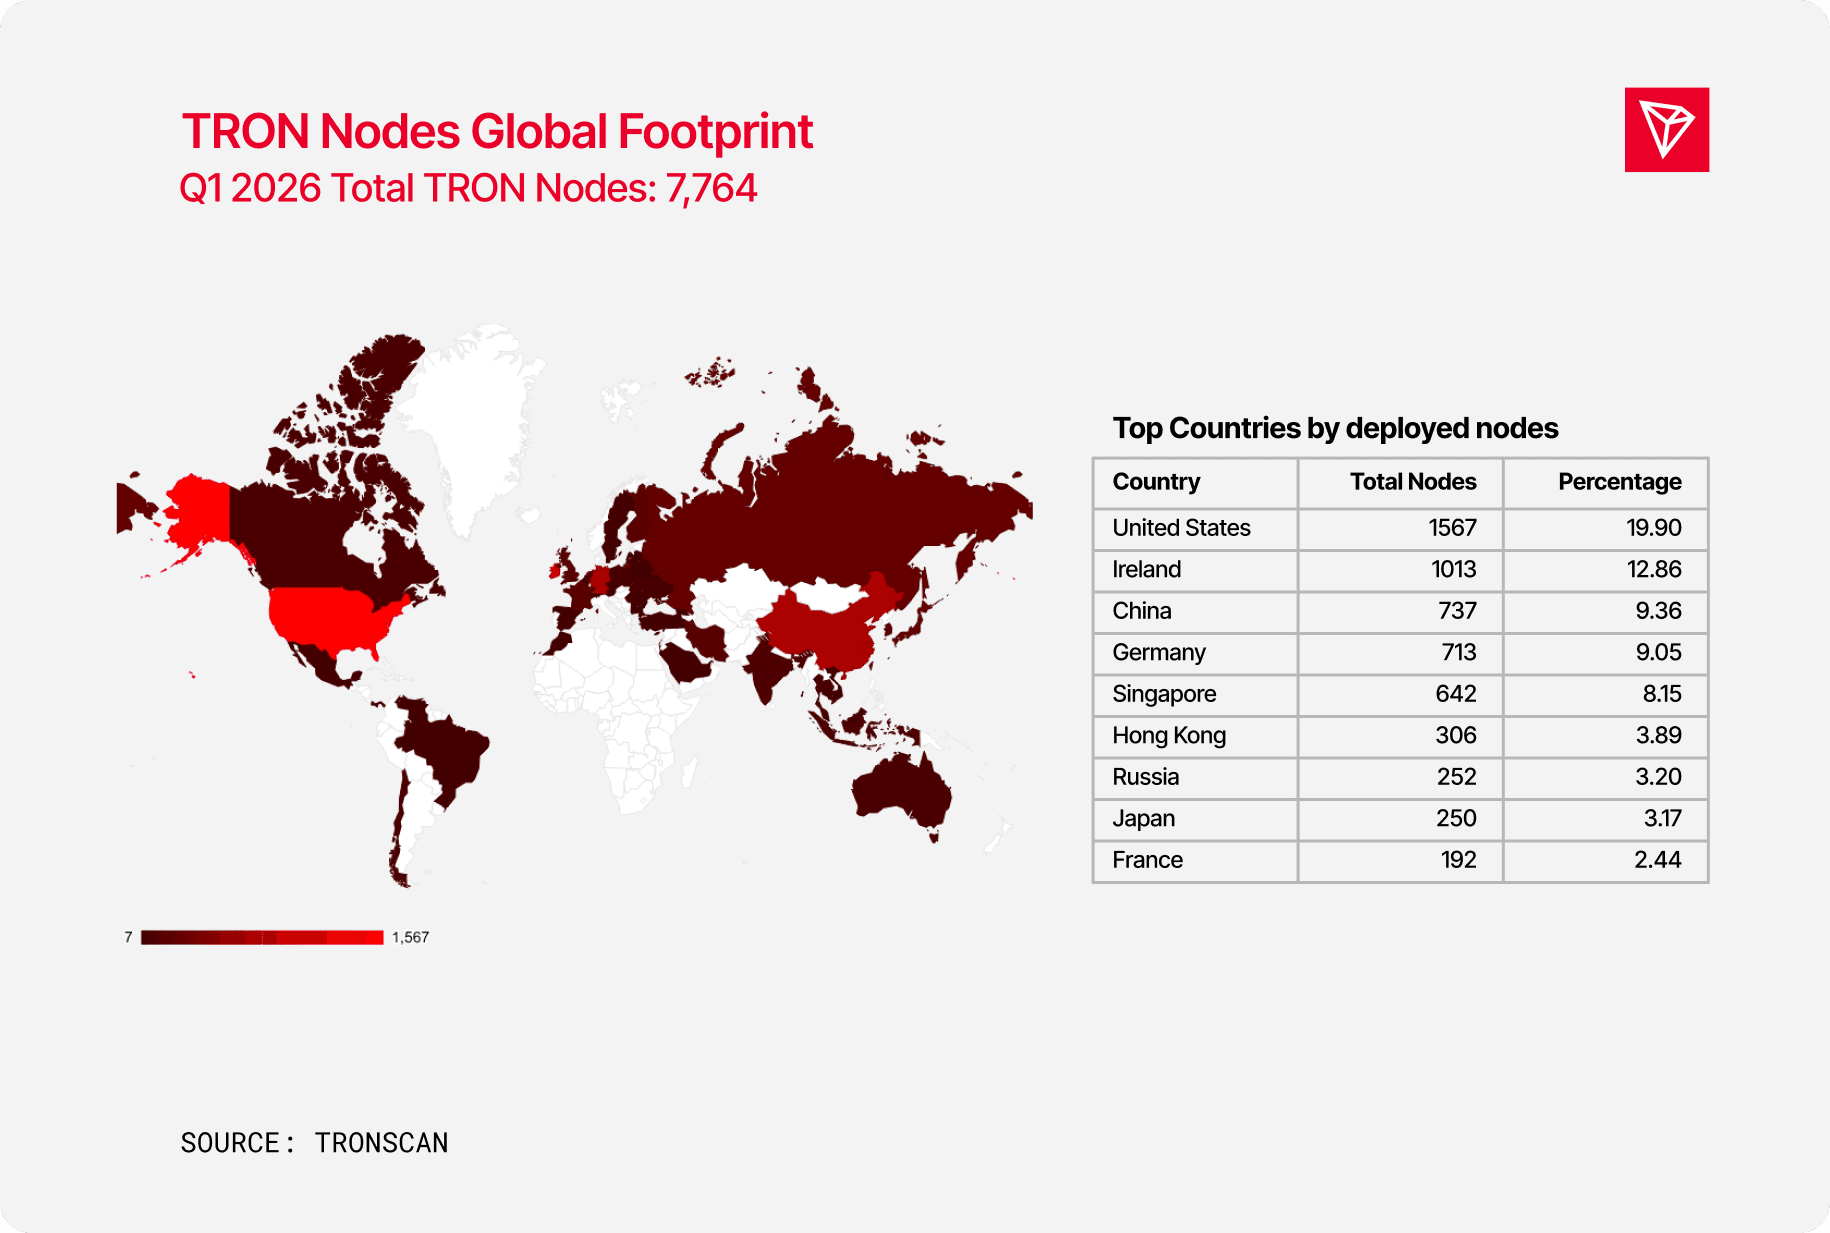
TRON Nodes Global Footprint
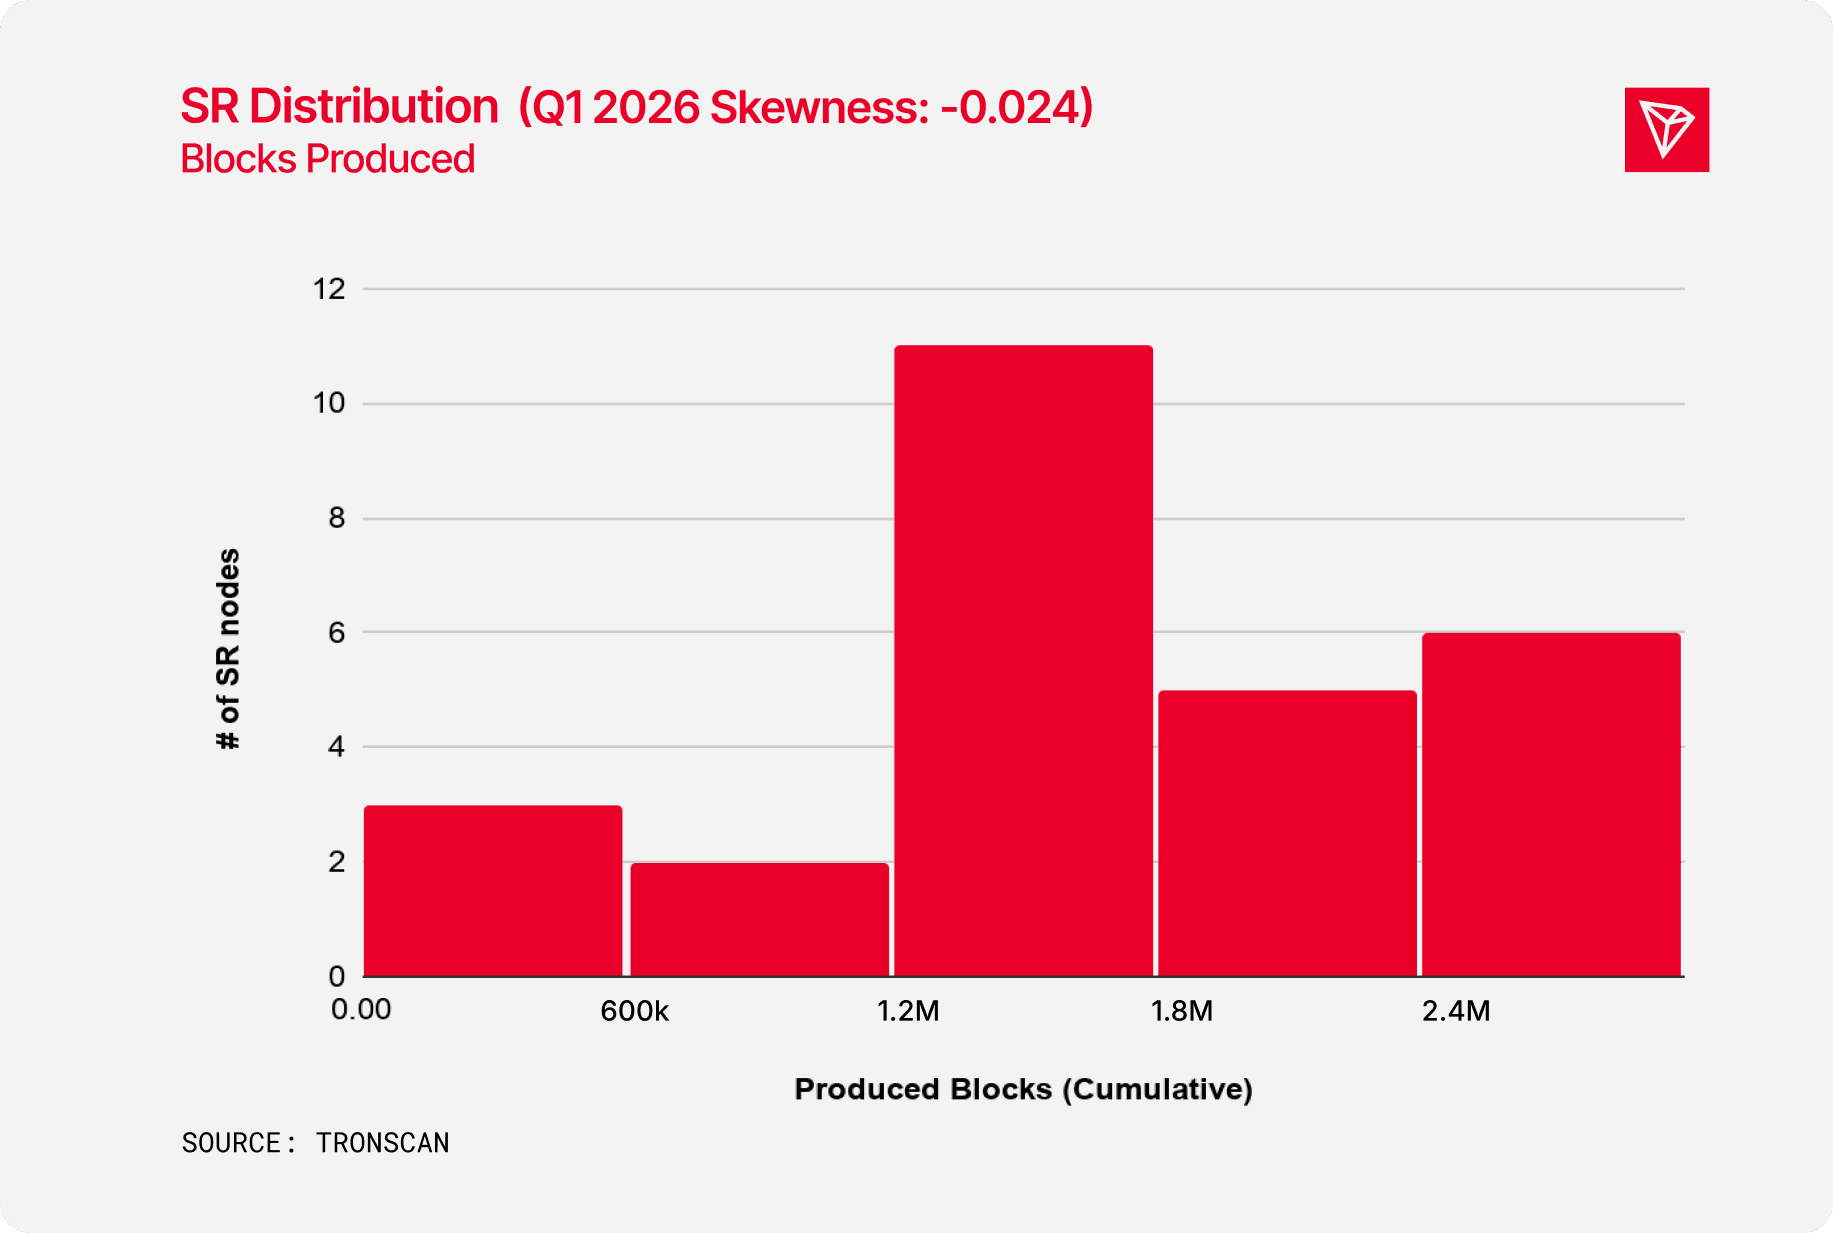
Block Production Distribution
The SR distribution by produced blocks shows a strong balance between established and newly elected SRs. TRON's dPoS consensus mechanism relies on mature block producers for stability and security, while new nodes are essential to prevent the long-term concentration of voting power.
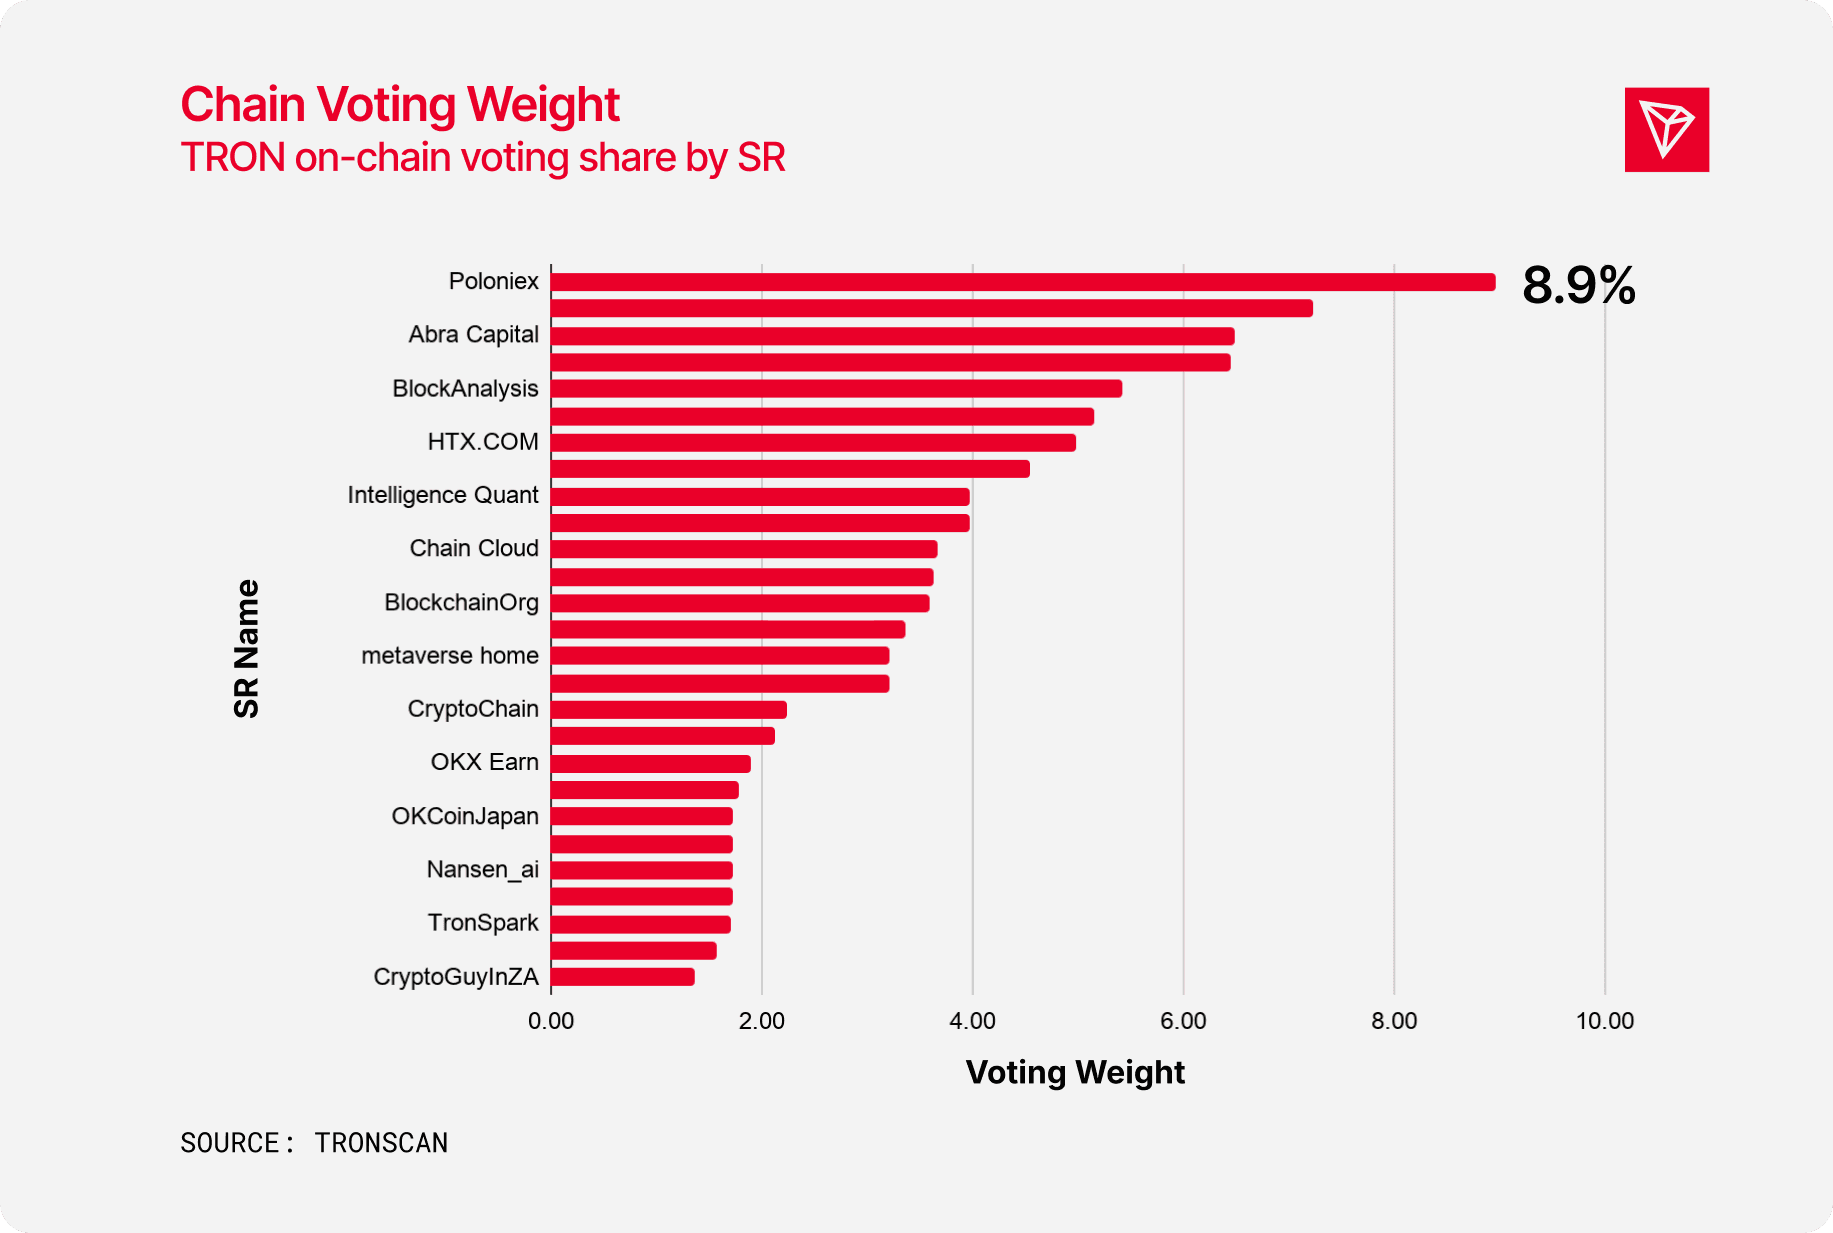
Voting Share
The top 13 Super Representatives (SRs) account for 68% of the total voting weight among all SRs.
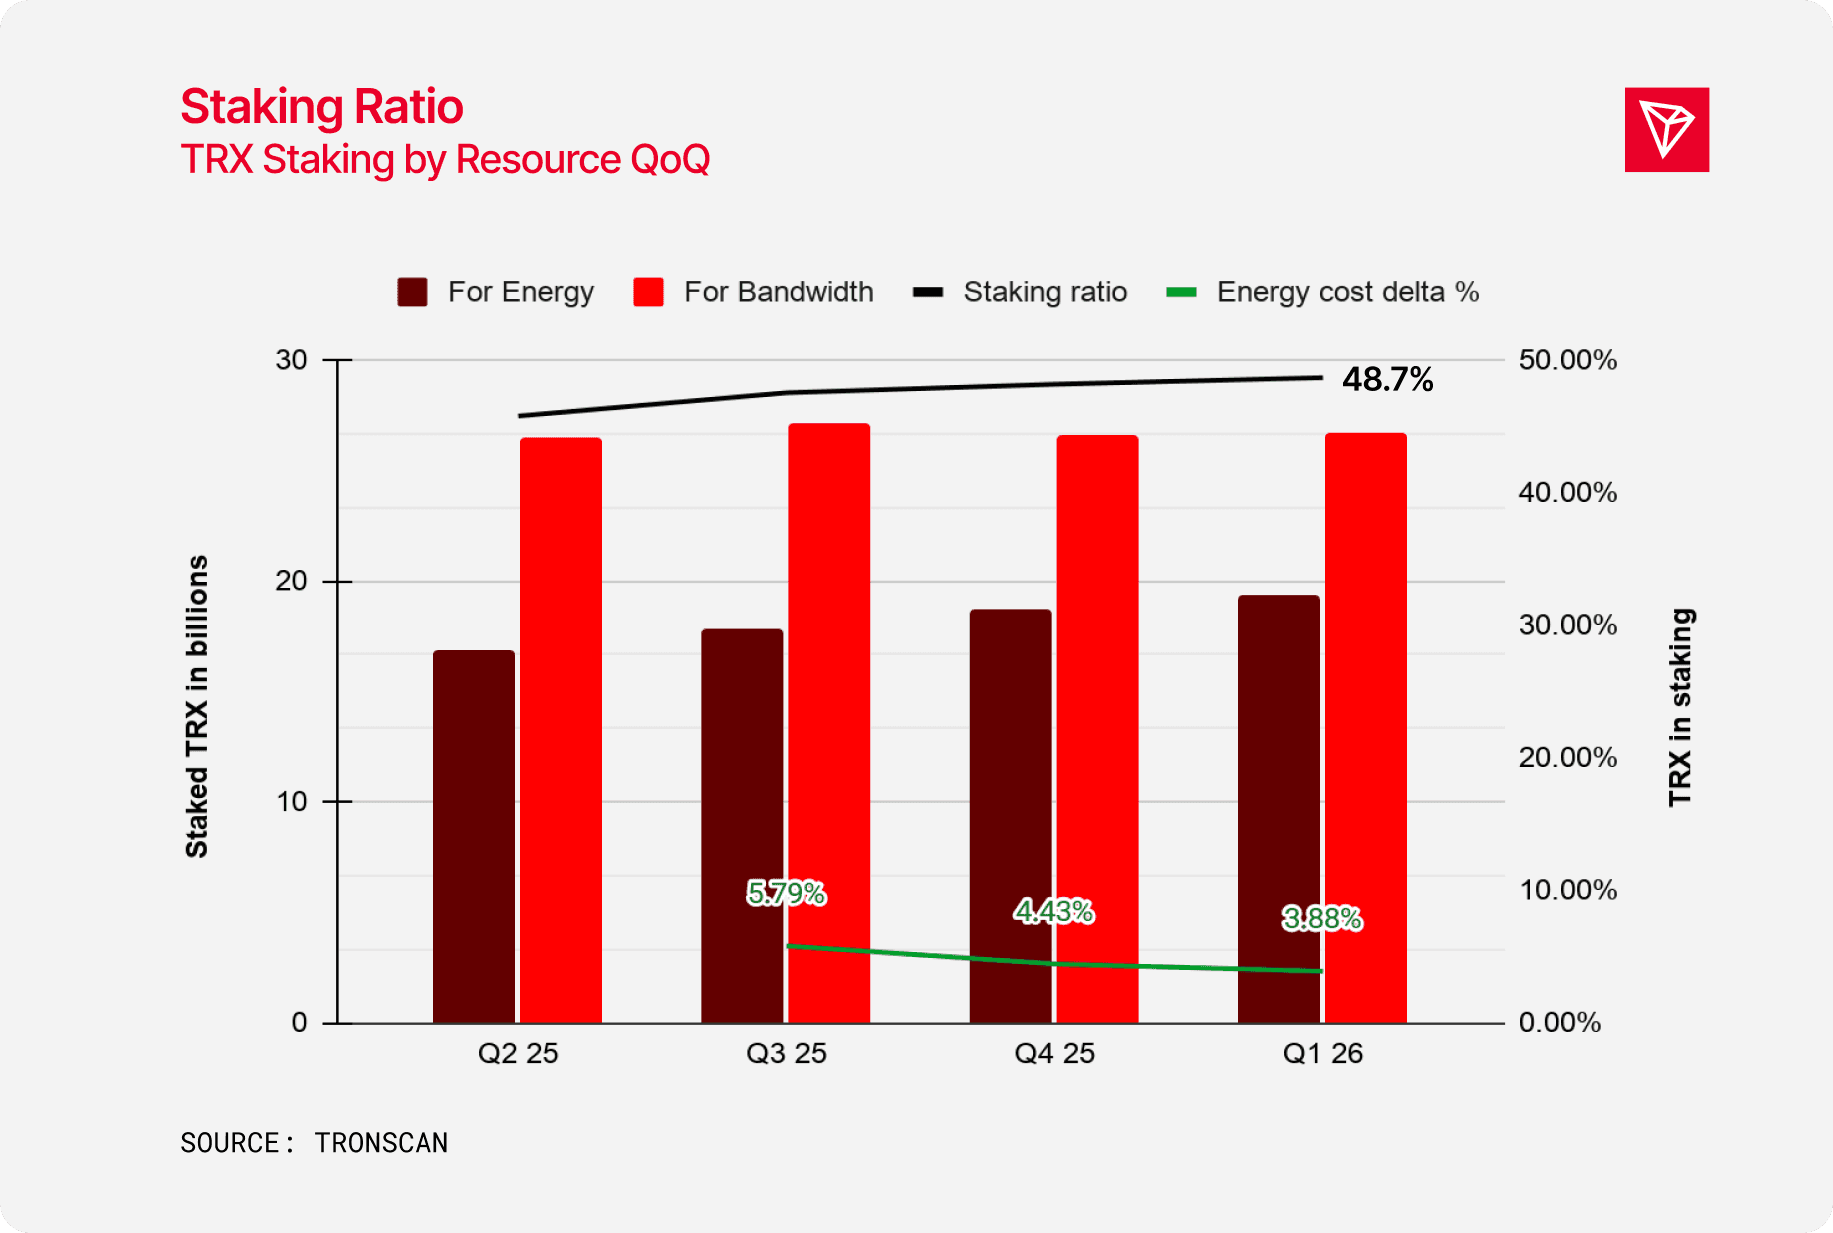
Staking
TRX staking for energy has increased by 3.8% in Q4, which indirectly results in a proportional txn cost increase for energy staking users.
A growing number of users are opting to stake for energy compared to bandwidth, signaling a higher appreciation for Energy to reduce fees for Smart Contract transactions.
Appendix
Data were collected from publicly available blockchain analytics platforms, including TRONSCAN, Dune Analytics, Token Terminal and Tether. Metrics were obtained through official APIs where available and supplemented with data from public dashboards. DEX data scope is limited to SunSwap V3 pool (DeFi and liquidity market volume report slides).
The datasets were cleaned and standardized by the author to ensure consistency across sources. This included removing incomplete records, aligning timestamps, and aggregating observations into comparable time intervals. When multiple sources reported similar metrics, primary on-chain data providers were prioritized.
All calculations and data transformations were performed by the author. Where applicable, raw observations were aggregated into monthly or quarterly intervals. The analysis relies exclusively on publicly accessible data, and results are independently verifiable through the referenced sources.
Read the Full Report
For a detailed breakdown of Q1 2026 performance, including full charts, metrics, and partner integrations, explore the complete TRON Q1 2026 Quarterly Report. The full report provides comprehensive data and context behind the network’s continued growth and infrastructure development.
" height="354.8315539739028px" id="Svi2alYpR" width="1202.1832633338345px"/></svg>)
